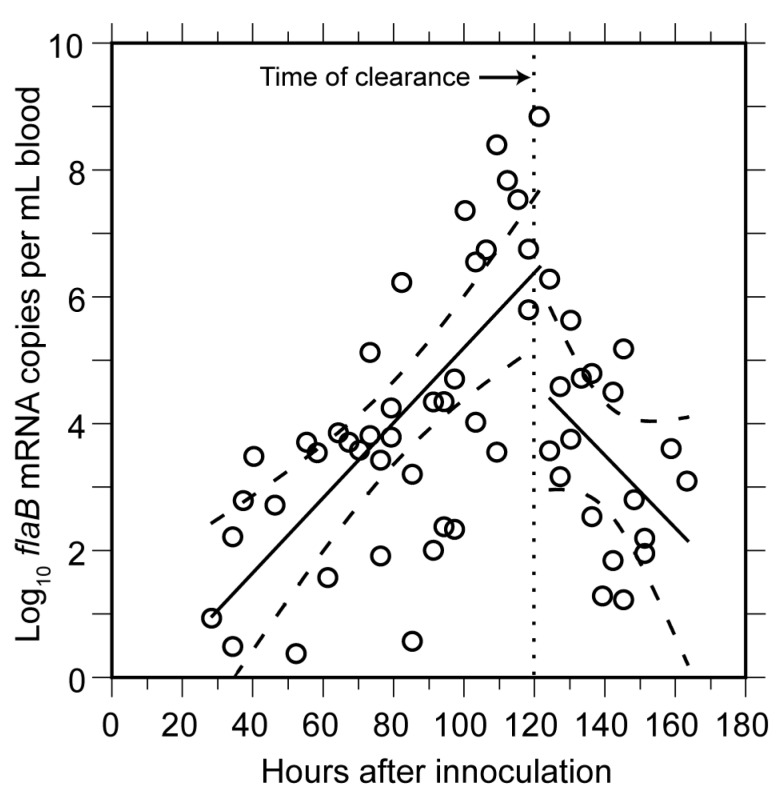
Figure 4.
Rise and decline in mRNA for FlaB flagellin of B. hermsii in blood of infected mice. The experiment and sampling protocol were the same as described for Figure 3. The flaB transcripts were estimated by qPCR of cDNA produced with random hexamers. Each data point is a sampling from a single mouse. Linear regression determinations (with 95% confidence intervals denoted by dashed lines) were made separately for time points up to hour 120 and after hour 120. The time of clearance indicated is the approximate time point that genome counts began to decline (Figure 3).

