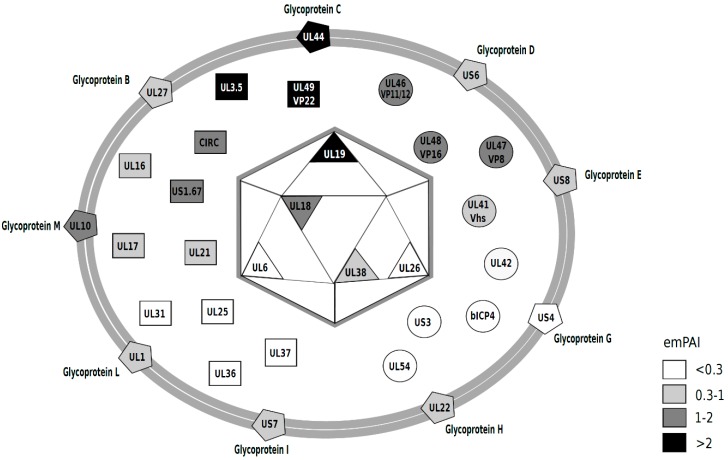
Figure 3.
Diagram of the BoHV-1.1 viral particle, representing the viral proteins detected in this study. The relative abundance was estimated based on emPAI scores [39] (Table 1) and are presented on a gray-scale that correlates with abundance (darker = more abundant). emPAI values < 0.3 (white); 0.3–1 (light gray); 1–2 (dark gray) and >2 (black). The diagram was inspired by those of past work [30,31,40].

