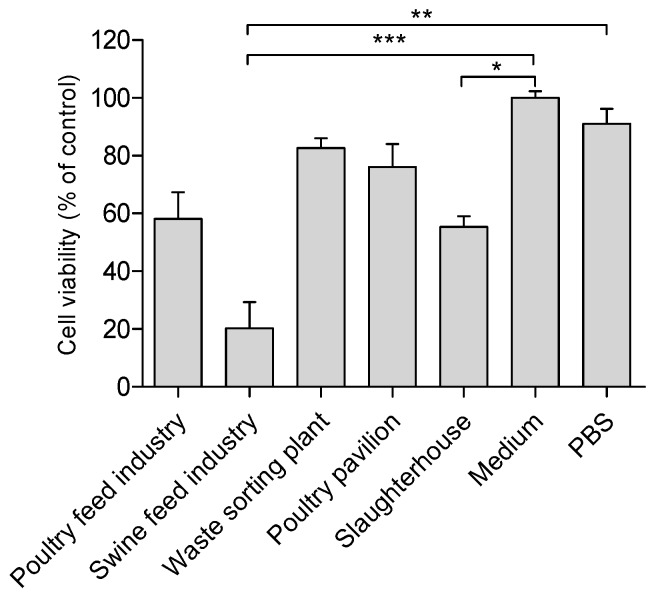
Figure 3.
Relative cell viability of THP-1 cell line. Columns represent mean values ± SEM (n = 4) for dilution 1:20 of air samples from five occupational settings. Statistical differences between the five occupational settings and control groups (medium and PBS) are reported as *** p < 0.001, ** p < 0.01, * p < 0.05. Cell viability (% of control) = (A) test/(A) control × 100.

