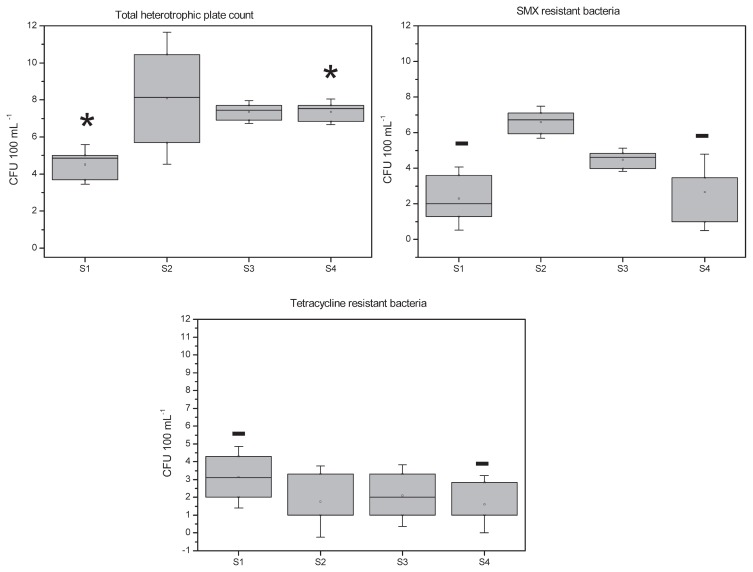
Fig. 2.
Log concentrations of total and antibiotic-resistant heterotrophic bacteria. Rectangular boxes indicate the interquartile range of data. The median value is indicated by the horizontal line inside the box. Small circles ‘q’ represent the mean values. Asterisks indicate samples that are significantly different (p<0.05) and the line over bars indicates samples with no significant differences (p>0.05).

