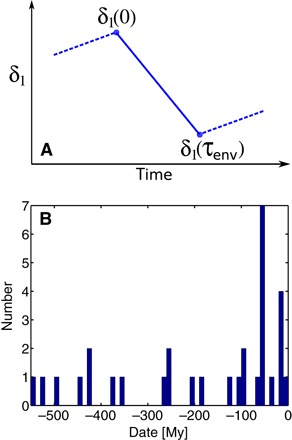
Fig. 1. Parameterization and temporal distribution of carbon isotopic events in the database.

(A) Schematic diagram illustrating how the parameters δ1(0) and δ1(τenv) are derived from an isotopic time series δ1(t). The time scale τenv represents the duration of time during which the isotopic composition δ1 decreases. (B) Histogram depicting the distribution of events in time.
