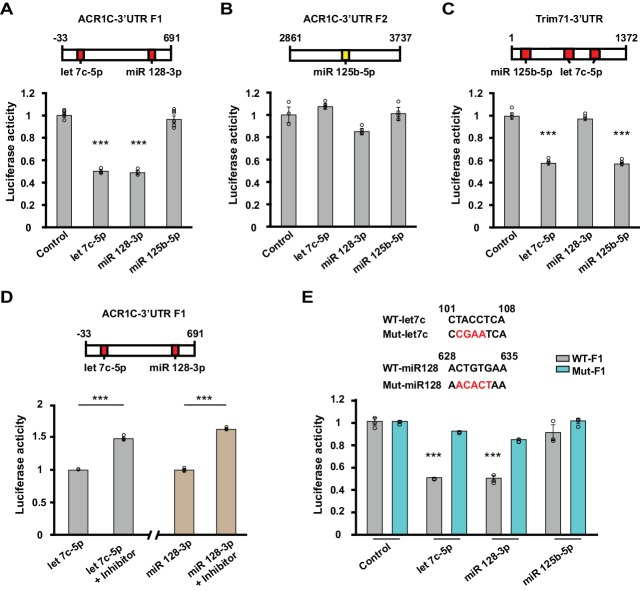
Figure 4. Let-7c-5p and miR-128–3p suppress luciferase activity of ACVR1C-3’UTR.
(A–D) Top, schematic diagrams illustrating the location of target sites for selected microRNAs in 3’UTR fragments. Values shown above the boxes indicate nucleotide positions relative to the start of the 3’UTR. Red indicates target sites of given microRNAs with high context percentile scores (> 80th percentile), while yellow indicates a lower context score. Bottom, bar graphs illustrate normalized luciferase activity (relative to control) from cells transfected with the listed microRNA mimics at a concentration of 2 nM (n = 3–6 per group). (A) The luciferase activity of the F1 reporter construct was reduced by either let-7c-5p (target position: 101–108) or miR-128–3 p (target position: 628–635) treatment (one-way ANOVA F(3,14) = 136.7, p<0.0001; Dunnett’s post hoc test control vs let-7c-5p or miR-128–3p: p=0.00000004 or 0.00000004, respectively). (B) The luciferase activity of the F2 reporter construct was unaffected by miR-125–5p (target position: 3248–3254) (one-way ANOVA F(3,8) = 5.59, p=0.023; Dunnett’s post hoc test control vs let-7c-5p, miR-128–3 p or miR-125–5 p: p=0.5, p=0.07, or p=0.9, respectively). (C) Treatment with either miR-125–5 p (target position: 79–86) or let-7c-5p (target position: 166–173 and 262–269) decreased the luciferase activity of the positive control TRIM71 reporter construct (one-way ANOVA F(3,8) = 217.799, p<0.0001; Dunnett’s post hoc test control vs let-7c-5p or miR-125–5 p: p=0.0000002 or p=0.0000002, respectively). (D) Left, luciferase activity was enhanced when cells were co-transfected with Let-7c-5p (2 nM) and its inhibitor (LNA-anti-let7c-5p, 25 pmol) compared to Let-7c-5p treatment alone (t-test, p=0.00003). Right, luciferase activity was increased when cells were co-transfected with miR128-3p (2 nM) and its inhibitor (LNA-anti- miR128-3p,25 pmol) compared to miR128-3p treatment alone (t-test, p=0.000006). (E) Top, schematics of WT and mutant sequences. Bottom, the effect of Let-7c-5p or miR128-3p treatment on reducing the luciferase activity of the WT F1 construct was prevented in the mutant F1 construct (let7c-5p: WT vs. Mut, t-test, p=0.00000005; miR 128–3p: WT vs. Mut, t-test, p=0.0001). *** indicates p<0.0005. Data are represented as mean ±SEM.

