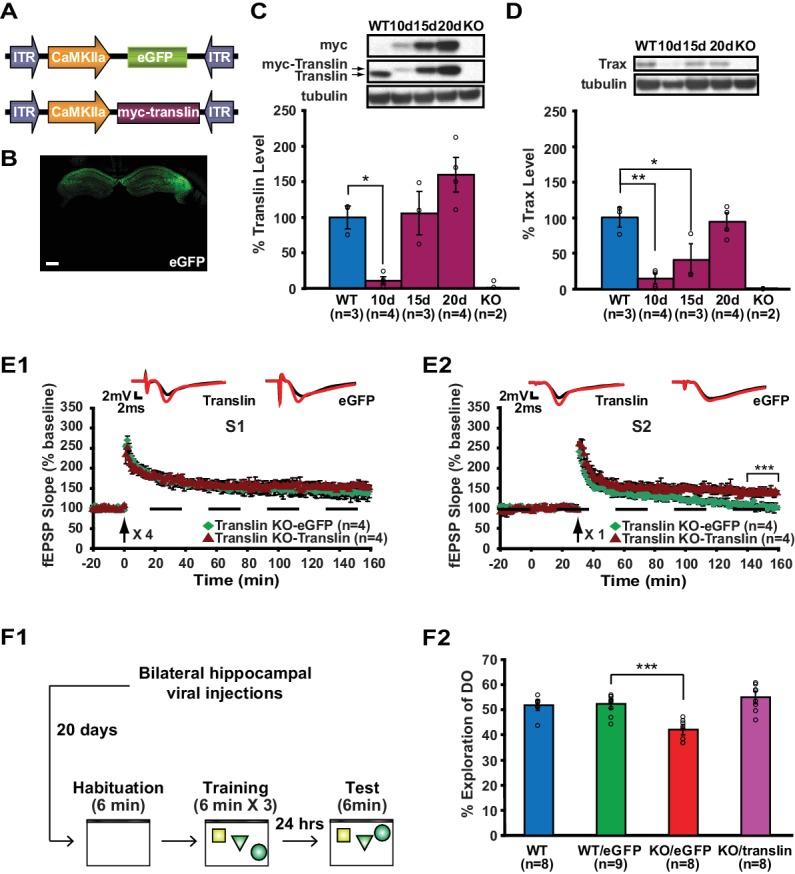
Figure 7. Viral restoration of translin/trax in hippocampal excitatory neurons rescues deficits in synaptic tagging and long-term memory in translin KO mice.
(A) Viral constructs designs. The expression of myc-tagged translin and eGFP is driven by the CamKII promotor. (B) A representative image of hippocampal eGFP expression from a coronal brain section of adult translin KO mice 20 days after viral injection. (C) The level of virally expressed myc-tagged translin reached WT levels 15 to 20 days after viral injection into the hippocampus of adult translin KO mice (one-way ANOVA, F(4,11) = 15.4, p=0.0002, Dunnett’s post hoc test, WT vs. KO15day: p=0.9, WT vs. KO20day: p=0.2). (D) Virally expressed translin restored trax to WT levels 20 days after injection (one-way ANOVA, F(4,11) = 14.7, p=0.0002, Dunnett’s post hoc test, WT vs. KO20day: p=0.9). (E) The viral restoration of translin levels in excitatory neurons of translin KO hippocampus reversed impaired persistent potentiation in pathway S2 (E2; two-way repeated-measures ANOVA, F(1,6) = 29.3, p=0.002) without affecting 4-train long-lasting potentiation in pathway S1 (E1; two-way repeated-measures ANOVA, F(1,6) = 2.5, p=0.2). (F1) A schematic diagram of the object-location memory task performed following bilateral hippocampal viral injections. (F2) Adult translin KO mice expressing eGFP explored the DO significantly less than WT littermates 24 hr after training. However, the behavior of adult translin KO mice expressing translin in excitatory neurons was similar to that of WT littermates or WT littermates expressing eGFP. Viral eGFP expression did not alter the behavior of WT littermates (one-way ANOVA, F(3,29) = 13.9, p=0.00001, Dunnett’s post hoc test, WTeGFP vs. KOeGFP: p=0.0001, WTeGFP vs. KOtranslin: p=0.5, WTeGFP vs. WT: p=0.9). n, number of mice. Scale bar: 20 µm. * indicates p<0.05, ** indicates p<0.005, *** indicates p<0.0005. Data are represented as mean ±SEM.

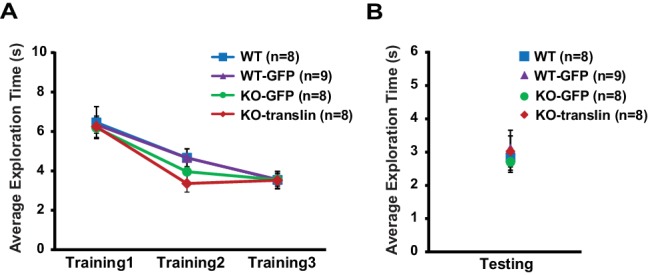
Figure 7—figure supplement 1. Viral expression does not alter exploratory behavior during object-location memory task in translin KO mice.


