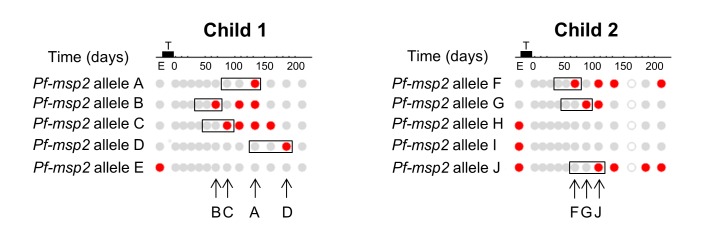
Definition of P. falciparum new infections in two exemplary children is shown. The study design and timelines of follow-up are shown in upper panel: enrolment visit (‘E’), followed by radical treatment (black bar ‘T’) and 235 days of follow-up. The presence of P. falciparum clones by sampling visit is visualized below. Columns represent sampling visits, rows represent P. falciparum msp2 alleles, that is distinct P. falciparum clones. Grey solid circles, P. falciparum negative sample, grey open circle, missing sample due to missed follow-up visit; red circle: sample positive for respective Pf-msp2 allele. New infections were defined as a positive sample preceded by two samples negative for this allele (black rectangles), excluding missed samples (see Child 2, allele F, days 120–200). The time point of new infections is marked by arrows for the two children.


