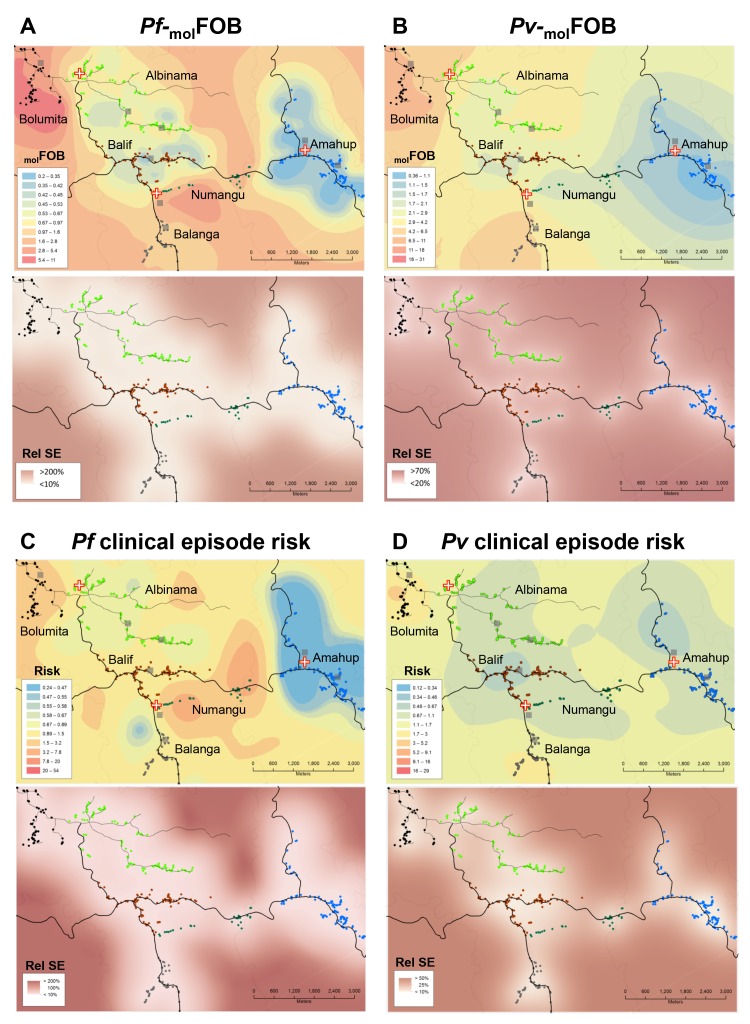
Figure 3. Heterogeneity in molFOB (A, B) and clinical episode risk (C, D) of P.falciparum (A, C) and P. vivax (B, D).
Upper panels show the kriging fit of model predictions of molFOB and clinical episode risk of children in both treatment arms. Lower panels show the standard error relative to the kriging estimate. Dots represent study participants’ houses and are color-coded according to village. Black lines: vehicle-accessible road; dark grey lines: vehicle-inaccessible road; light grey lines: river; red/white cross: health center or aid post; grey square: school or enrolment location. Maps were prepared using ArcGIS 10.2 (Esri, USA).

