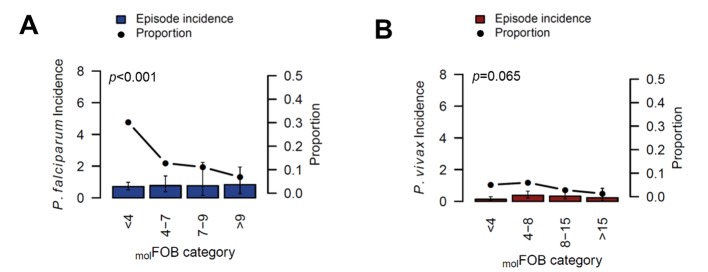
Figure 4. The incidence of P.falciparum (A) and P. vivax (B) clinical episodes relative to molFOB.
Mean clinical episode incidence is shown as bars (left axis) and proportion of clinical episode incidence divided by molFOB as connected dots (right axis). Error bars represent 95% CIs. p-values refer to the differences between groups in the proportion of clinical episodes and new infections, assessed by Chi2 or Fisher’s exact test.

