. 2017 Sep 5;6:e30697. doi: 10.7554/eLife.30697

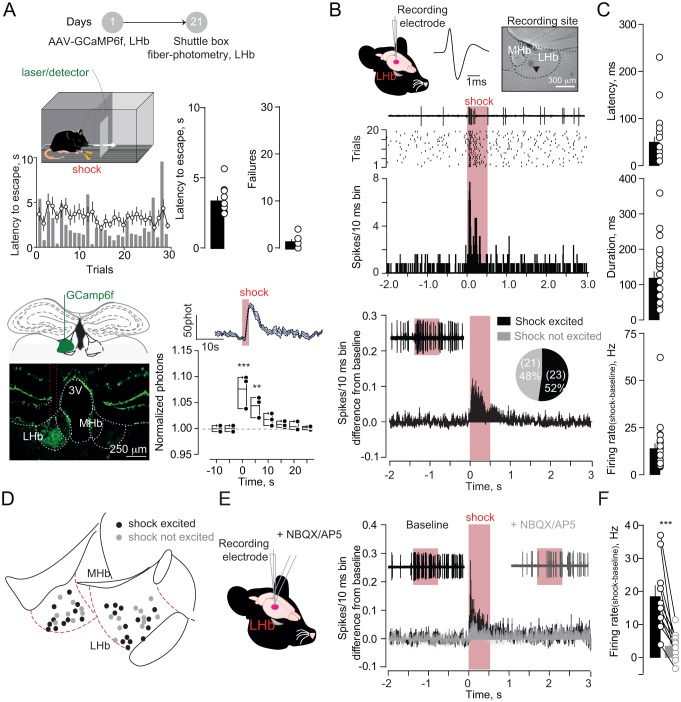
Figure 1. Foot-shocks promote escape behavior and glutamate-dependent phasic excitation of LHb.

(A) Experimental timeline, representative histogram and bar graphs reporting foot-shock (Fs)-driven mouse behavior (latency to escape and failures) (N = 10). Bottom, GCamp6f expression in LHb and Fs-mediated Ca2+ transients (N = 3, one way ANOVA RM, F = 14.24, ***p<0.0001). (B) Spike waveform and recording location of a LHb neuron (arrow, pontamine sky blue dye). Representative trace, raster plot and peristimulus time histogram (PSTH) for Fs-evoked excitation (Fs, 0.5 s, 3mA, ISI: 5 s). Bottom. PSTH reporting average spike counting and pie-chart for Fs-excited LHb neurons ((Firing rate/10 ms-average 2 s pre-shock)/Total trials) (N/n = 7/44). (C) Analysis of Fs excitation in LHb neurons. (D) Territorial distribution of Fs-excited and not-excited neurons. (E) PSTHs reporting Fs responses before/after local infusion of NBQX/AP5. (F) Bar graph and scatter plot for shock-driven activity before/after NBQX/AP5 (N/n = 6/10, paired t-test, t = 5.05; ***p=0.0007). Results are reported as mean ±S.E.M. N = mice; n = cells. 3V, 3rd ventricle, MHb, medial habenula. See Figure 1—source data 1.

Figure 1—source data 1.
elife-30697-fig1-data1.xlsx (383.4KB, xlsx)
DOI: 10.7554/eLife.30697.005

Figure 1.

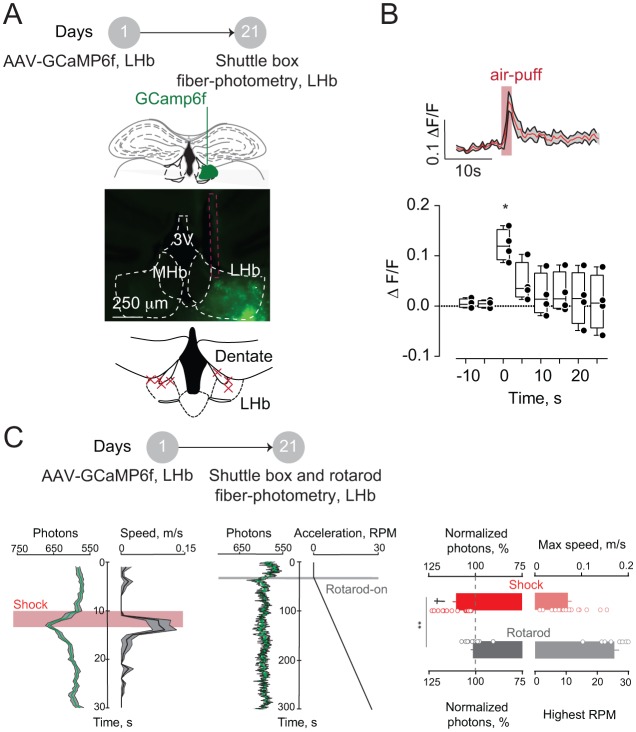
Figure 1—figure supplement 1. Aversive stimuli and locomotion differentially affect LHb neuronal activity.

Figure 1—figure supplement 1.

(A) Timeline of the experiments, representative coronal sections showing the GCamp6f expression and the fiber placement (red dashed line) in the LHb. Bottom. Schematic of a LHb-containing coronal section with the fibers placement (red crosses, N = 7). (B) Representative trace and averaged time-course graph with plots showing the calcium dynamics upon an unpredicted air-puff (5 trials per mouse) eject on the mouse-tail (N = 4, One way Anova, F = 7.13, *p=0.03). (C) Representative calcium transients (green, average of 10 trials after shock and 5 during rotarod from a single mouse) and the relative change in locomotion (black). Right, bar graphs and scatter plot reporting the maximal normalized calcium transients at the peak of locomotion (N = 2, Shock versus rotarod, unpaired t-test, t = 3.44, **p=0.0018; Shock versus baseline, unpaired t-test, t = 6.27, p<0.0001; Rotarod versus baseline, unpaired t-test, t = 1.002, p=0.34). Results are reported as mean ±S.E.M. N = mice. 3V, third ventricle, MHb, medial habenula. See also Figure 1. See Figure 1—figure supplement 1—source data 1.
Figure 1—supplement figure 1—source data 1.
elife-30697-fig1.xlsx (670.3KB, xlsx)
DOI: 10.7554/eLife.30697.006
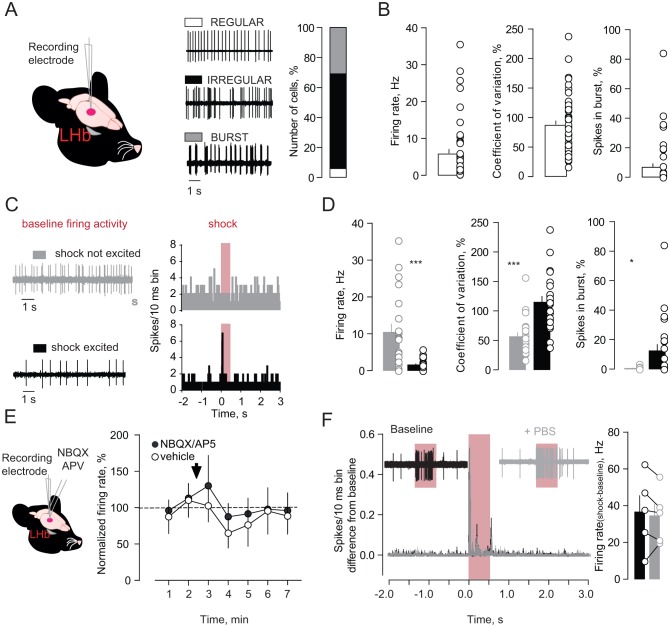
Figure 1—figure supplement 2. Firing properties and pharmacology of foot-shock responses in LHb neurons of anesthetized mice.

Figure 1—figure supplement 2.

(A) Schematics of recordings, traces and bar graph showing the firing pattern of LHb neurons (N/n = 7/44). (B) Bar graphs and single plots reporting electrophysiological properties of LHb neuronal firing activity. (C) Examples of baseline activity and FsE responses (PSTHs) acquired respectively from a Fs not excited (gray) and a Fs excited (black) neuron. (D) Bar graphs and plots reporting the electrophysiological properties of the LHb Fs excited (n = 23) and not-excited (n = 21) neurons. Note the typical irregular and low bursty firing activity of the LHb Fs encoding neurons (Unpaired t-test, firing rate, t = 4.11, ***p=0.0002; spikes in burst%, t = 2.63, *p=0.011; coefficient of variation%, t = 4.83, ***p<0.0001). (E) Schematic of recordings and local pharmacology. Time-course graph reporting the overall effect on firing activity of NBQX/AP5 (N/n = 6/10; One way ANOVA RM, F = 0.46, p=0.61) and vehicle local infusion (N/n = 2/5; One way ANOVA RM, F = 0.51, p=0.61). (F) Traces, averaged PSTHs, bar graph and plots showing the Fs response on LHb neurons before and after local infusion of vehicle (N/n = 2/5, paired t-test, t = 0.66, p=0.54). N = mice, n-cells. See also Figure 1. See Figure 1—figure supplement 2—source data 1.
Figure 1—supplement figure 2—source data 1.
elife-30697-fig2.xlsx (82.4KB, xlsx)
DOI: 10.7554/eLife.30697.007