. 2017 Sep 5;6:e30697. doi: 10.7554/eLife.30697

Figure 2. Hypothalamic, but not mesencephalic, excitatory projections mediate foot-shock excitation of LHb neurons.

(A) Experimental timeline, representative images for CoChR expression and recording map in LHb. Bottom. Sample currents and amplitude bar graphs for VTA→LHb terminals optical stimulation at rest (N/n = 4/11). (B) Same as (a) but for LH→LHb (N/n = 5/9). (C) Experimental timeline and DREADDi expression in mVTA somata and LHb terminals. Averaged PSTH, bar graph and scatter plot for Fs-driven excitation before/after local CNO (CNO, 100 µM; N/n = 4/7; paired t-test, t = 0.69 p=0.51). (D) Same as (c) but for LH→LHb projections (N/n = 5/7; paired t-test, t = 2.45 *p=0.04). Results are reported as mean ± S.E.M. N = mice; n = cells. 3V, third ventricle, MHb, medial habenula, EPN, entopeduncular nucleus, PAG, periaqueductal gray, IPN, interpeduncular nucleus, VTA, ventral tegmental area, Sn, substantia nigra, VmH, ventral medial hypothalamus. See Figure 2—source data 1.

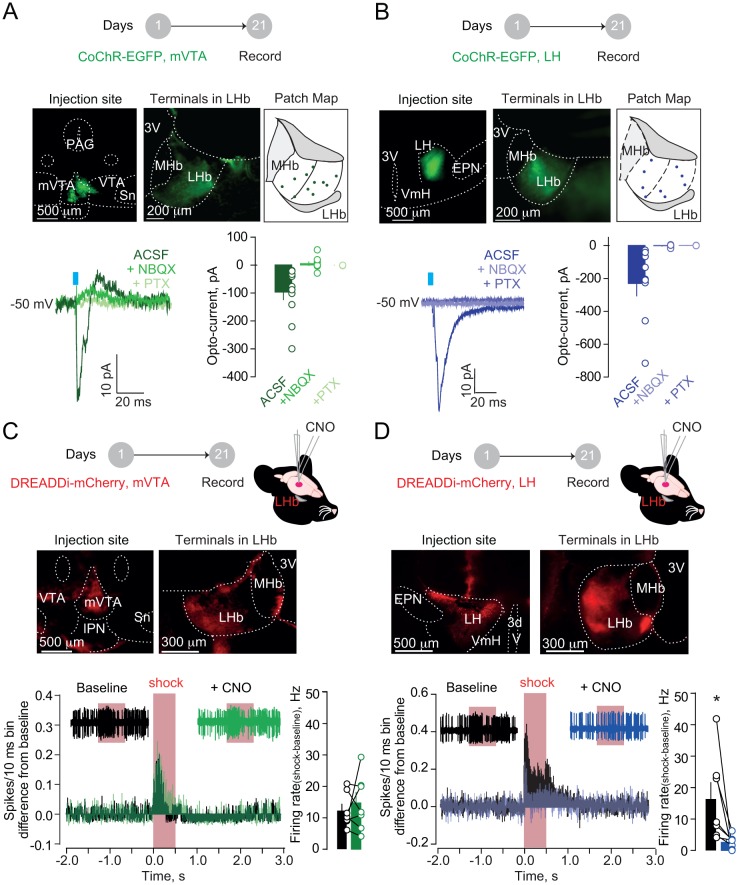
Figure 2—source data 1.
elife-30697-fig2-data1.xlsx (132.2KB, xlsx)
DOI: 10.7554/eLife.30697.012

Figure 2.

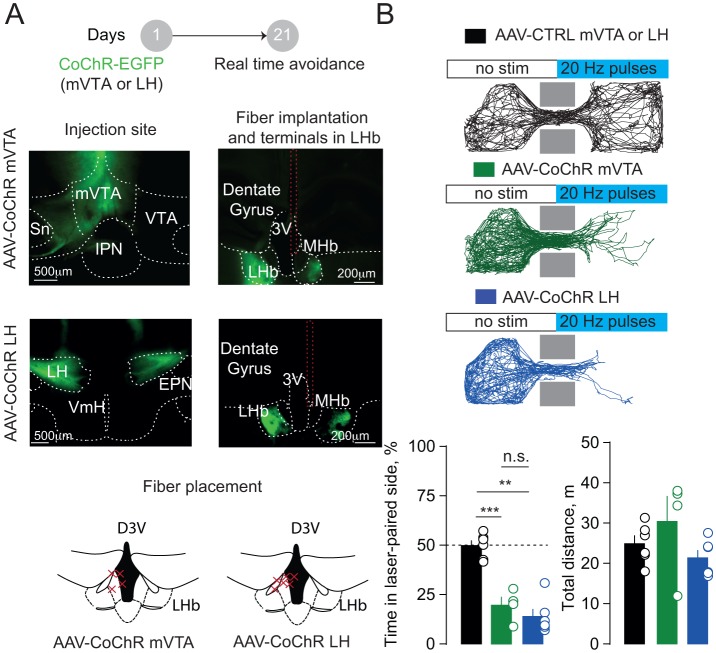
Figure 2—figure supplement 1. Activation of hypothalamic and mesencephalic terminals within the LHb triggers place aversion.

Figure 2—figure supplement 1.

(A) Schematic of the real time place aversion test and sample pictures reporting CoChR expression in the injection site and in the LHb. Red dashed lines highlight the fiber track. Bottom, LHb-containing coronal section reporting the placement of the fibers in CoChR injected mice. (B) Tracks of single mice performances in the three groups tested. Each time the mouse crossed in the light-paired compartment blue light stimulation was triggered (20 Hz). Bottom, bar graphs and plots showing % of total time spent the laser-paired compartment (one way ANOVA, F = 35.51, ***p<0.0001) and the total distance travelled (one way ANOVA, F = 1.87, p=0.19) in the three groups (CTRL vs LHCoChR vs mVTACoChR, N = 6, 6, 4). N = mice. 3V, third ventricle, MHb, medial habenula, EPN, entopeduncular nucleus, IPN, interpeduncular nucleus, VTA, ventral tegmental area, Sn, substantia nigra, VmH, ventral medial hypothalamus. See also Figure 2. See Figure 2—figure supplement 1—source data 1.
Figure 2—supplement figure 1—source data 1.
elife-30697-fig3.xlsx (42.4KB, xlsx)
DOI: 10.7554/eLife.30697.013
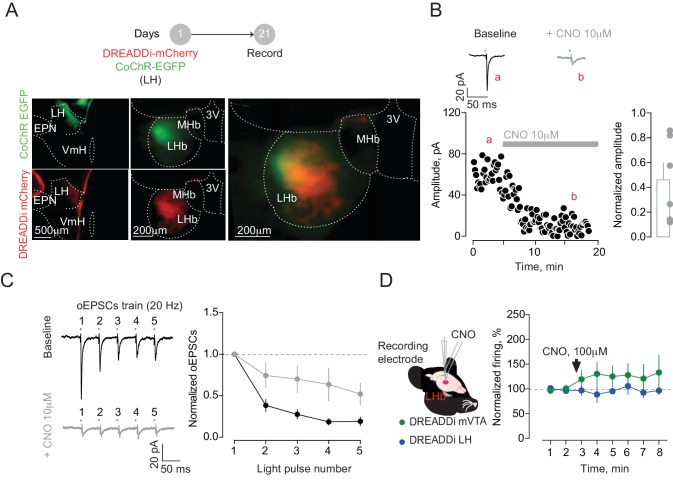
Figure 2—figure supplement 2. DREADDi activation reduces input-specific presynaptic glutamate release but does not affect LHb baseline firing rate in vivo.

Figure 2—figure supplement 2.

(A) Experimental timeline and representative pictures showing the expression of CoChR and DREADDi in the injection (LH) and recording sites (LHb). (B) Traces and time-course plots of LH opto-evoked currents before (a) and after (b) CNO application in a LHb neuron recorded in acute slices. Bar graph and plots reporting the overall decrease of the opto-evoked excitatory post-synaptic currents (oEPSCs) upon CNO application (N/n = 3/6 paired t-test, t = 3.97, *p=0.01). (C) Sample traces and averaged graph showing the effect of LH terminals DREADDi activation on oEPSCs train in LHb neurons (two way ANOVA RM, interaction: F = 3.65, *p=0.01). (D) Schematics of the double-barrel system allowing a local infusion of CNO in close proximity of the recording site. The time-course graph reports the effect of DREADDi activation on the firing activity of LHb neurons in mice expressing DREADDi in mVTA (N/n = 4/7, one way ANOVA RM, F = 0.57, p=0.57) or LH (N/n = 5/7, one way ANOVA RM, F = 0.26, p=0.72). N = mice, n = cells. 3V, third ventricle, MHb, medial habenula, EPN, entopeduncular nucleus, VmH, ventral medial hypothalamus. See Figure 2—figure supplement 2—source data 1.
Figure 2—supplement figure 2—source data 1.
elife-30697-fig4.xlsx (46.1KB, xlsx)
DOI: 10.7554/eLife.30697.014
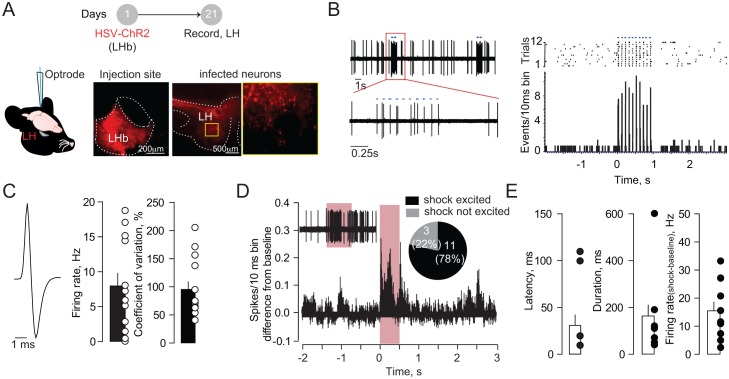
Figure 2—figure supplement 3. Neurons in the LH projecting to LHb show fast and phasic excitation upon foot-shock.

Figure 2—figure supplement 3.

(A) Schematic of the experiments: an HSV-based (HSV-EF1α-ChR2-mCherry) virus was injected in LHb allowing retro-transport of ChR2 in all neurons projecting to the LHb. Recordings were performed in LH and neurons identified by blue light (1 ms, 470 nm) stimulation delivered through an optrode. Representative pictures showing injection site and ChR2 transfection in LH neurons. (B) Sample recording and PSTHs built from a LHb-projecting LH neuron. The opto-stimulation (10 pulses, 10 Hz) evoked time-locked spikes. (C) Averaged spike waveform, bar graphs of firing rate and coefficient of variation expressed in % (N/n = 4/14). (D) Averaged PSTHs and pie-chart highlighting the Fs response of LHb-projecting LH neurons (Fs-excited/not excited = 11/3 neurons). (E) Electrophysiological properties of the LH neuronal excitation upon foot-shock. N = mice, n = cells. See also Figure 2. See Figure 2—figure supplement 3—source data 1.
Figure 2—supplement figure 3—source data 1.
elife-30697-fig5.xlsx (70.4KB, xlsx)
DOI: 10.7554/eLife.30697.015