. 2017 Aug 21;6:e26653. doi: 10.7554/eLife.26653

Figure 4. Maximum probability tractograms of the subdivisions of substantia nigra.

A limbic-cognitive-motor organizational topography of SN projections is shown in multi-slice views (A) with a focus on prefrontal cortex, striatum and pallidum (B). Maximum probability tractograms were generated by assigning each voxel to the corresponding SN subdivision with which it showed the greatest connections. SN subdivisions: vSN (blue), mSNc (green) and lSNc (orange).

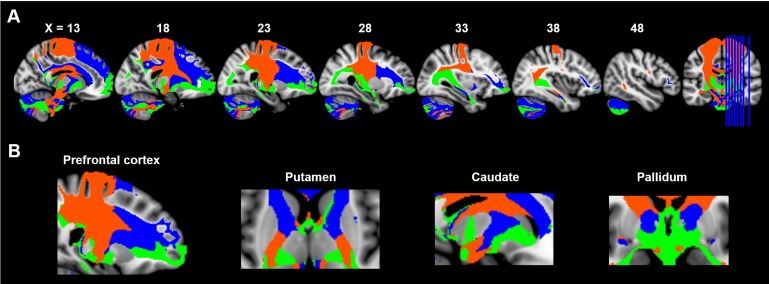
Figure 4.

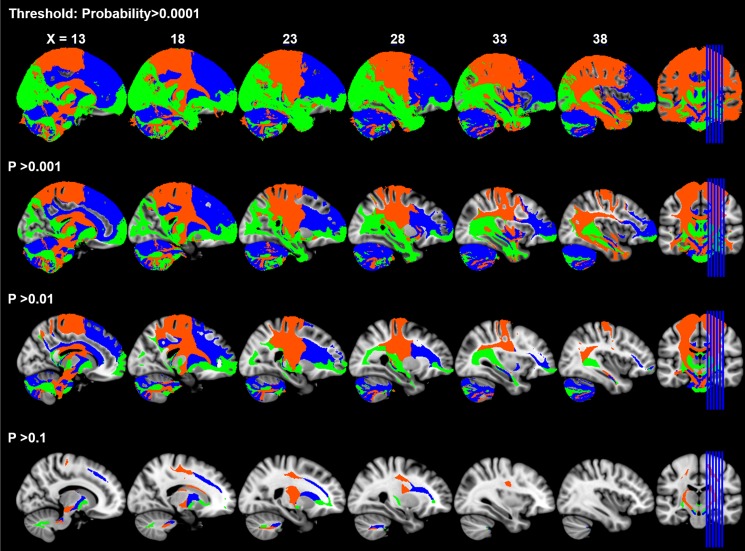
Figure 4—figure supplement 1. Maximum Probability Map of tractograms from SN subdivisions under different thresholds of tractography probability.

Figure 4—figure supplement 1.

The limbic-cognitive-motor topology of SN projections was consistently revealed at different levels of probability thresholds. As the threshold increases, the tractographic MPM shrinks into the skeleton of major fiber tracts but the organizational pattern remains.
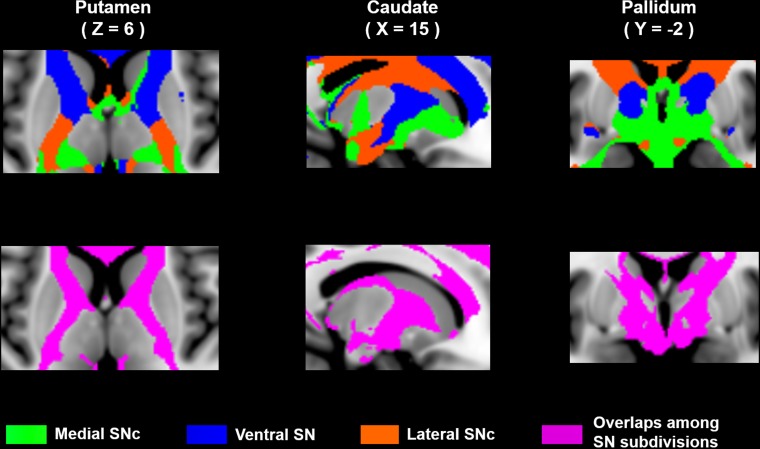
Figure 4—figure supplement 2. Distinct and overlapping projections of SN subdivisions in basal ganglia.

Figure 4—figure supplement 2.

The first row shows the distinct connectivity patterns of SN subdivisions in striatum and pallidum, adapted from Figure 4B. The second row indicates the overlaps among SN projections.