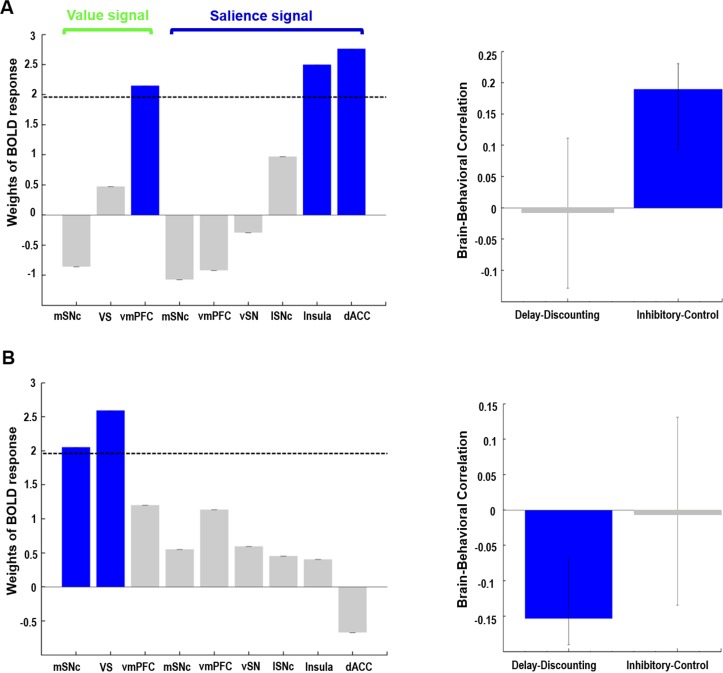
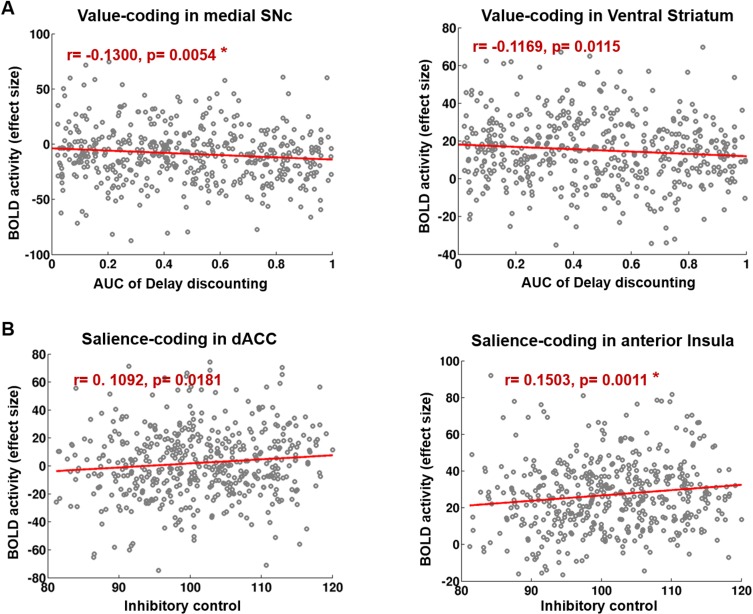
Figure 7. Behavioral PLS analysis on value- and salience-coding BOLD response and two measures of impulsivity.
Two orthogonal components were identified. The first component (A) captured the relationship between value signal from vmPFC, salience signals from anterior insula and dACC, and inhibitory control scores on the Flanker task. The second component (B) captured the relationship between value signals from mSNc and VS, and the AUC measure of delay discounting. Value and salience BOLD signals were derived from the gambling task. Note: for delay-discounting lower AUC indicates greater impulsivity. (AUC: area under the curve). In the leftmost panel, blue color of the bars indicates a reliable contribution (z > 1.96) as determined by the bootstrap procedure. Error bars in the middle panel represent 95% confidence intervals derived from bootstrap resampling. See text for abbreviations.


