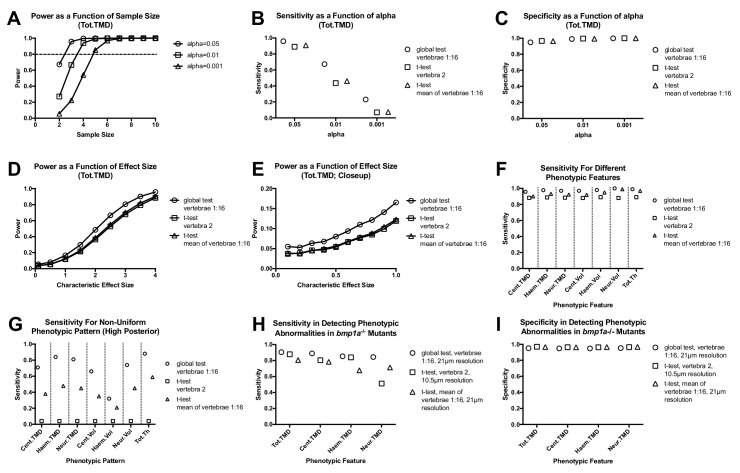
Figure 4. Analyzing vertebral patterns confers heightened sensitivity in discriminating mutant phenotypes compared to analyzing individual vertebrae.
Figures A-G show results from Monte Carlo simulations using simulated mutant phenotypes. (A) Power of the global test in discriminating a uniform increase in Tot.TMD (characteristic effect size: d = 4) as a function of sample size and alpha value. The dotted line highlights sample sizes with power >0.8. (B) Sensitivity (fraction of times in which p<0.05 when comparing simulated mutant vs. WT fish) for different test procedures. (C) Specificity (1 - fraction of times in which p<0.05 when comparing WT vs. WT fish) for different test procedures. (D) Power as a function effect size for different test procedures (sample size: n = 3; alpha = 0.05). (E) Closeup of figure (D) for smaller effect sizes. (F) Comparison of sensitivity for different phenotypic features (characteristic effect size: d = 4; sample size: n = 3; alpha = 0.05). (G) Sensitivity for non-uniform phenotypic pattern (linear increase from d = 0 at vert 1 to d = 4 at vert 16; n = 3; alpha = 0.05). Figure H-I show results from Monte Carlo simulations using parameter estimates derived from bmp1a-/- mutants. (H) Sensitivity in discriminating different phenotypic features in bmp1a-/- mutants. T-tests using individual vertebrae were performed on data derived from fish scanned at high resolution. (I) Specificity in discriminating different phenotypic features in bmp1a-/- mutants.

