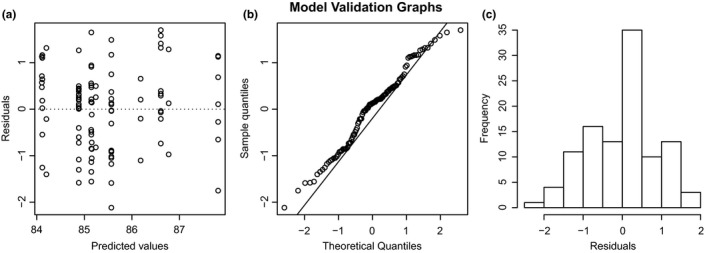
Figure 4.

Model validation graphs showing residuals closely approximating a normal distribution with no violation of the assumption of homogenous variance. The graphs are (a) predicted values against residuals that are clearly spread out, (b) a linear relationship between sample quantiles and theoretical quantiles, and (c) histogram showing a normal distribution between frequency and residuals
