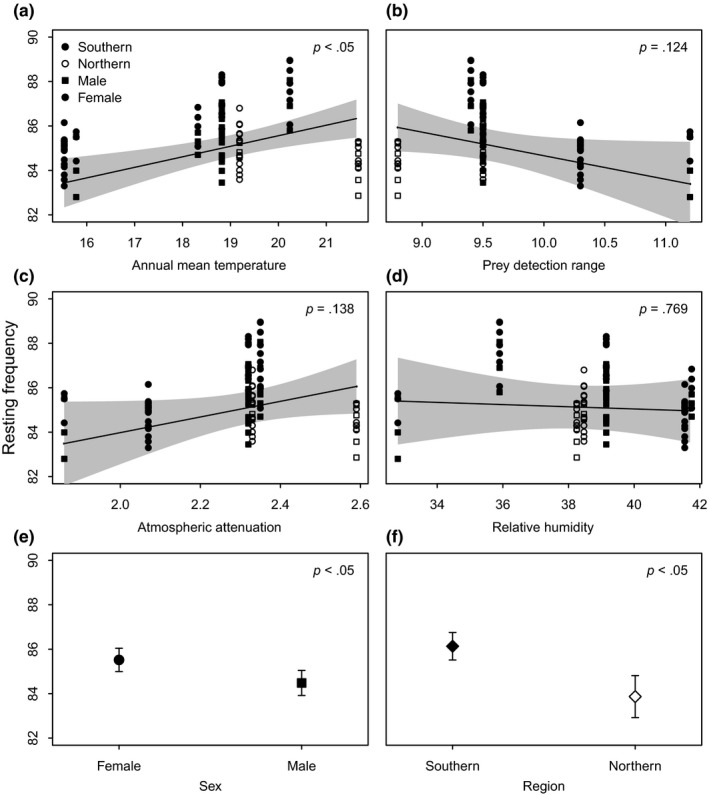
Figure 5.

Predicted effects of (a) annual mean temperature (AMT); (b) prey detection ranges (PDR); (c) atmospheric attenuation (AA); (d) relative humidity (RH); (e) sexual dimorphism and (f) region on RF variation in Rhinolophus damarensis. The gray‐shaded areas and error bars represent 95% confidence intervals
