
Figure 2.
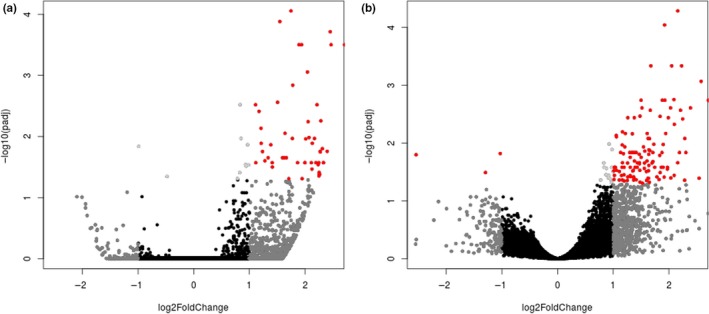
Differential expression between control (Mymy‐Pos) and exposed (Mymy‐Neg) treatments illustrated with volcano plots, showing the log of the adjusted p‐value as a function of the log ratio of differential expression based on (a) RSEM and DESeq2, and (b) RSEM and edgeR. Colored data points plot groups of genes based on fold change and FDR cutoff: red (>2 fold change, FDR < 0.05), dark gray (>2 fold change, FDR > 0.05), light gray (<2 fold change, FDR < 0.05), black (<2 fold change, FDR > 0.05)