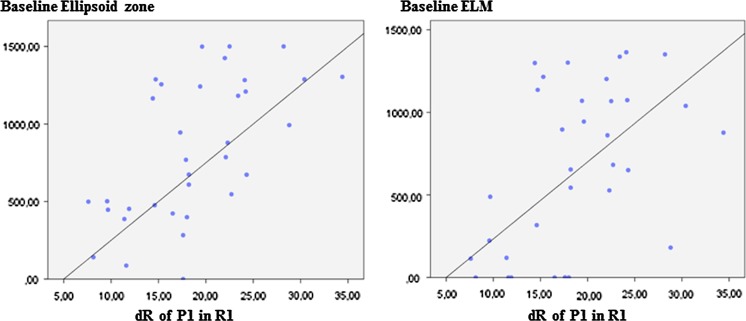
Fig. 3.
Scatter plot of the relationship between the response density of the P1 wave in the foveola (R1) compared to the preservation of the ellipsoid zone and the ELM, before treating with ranibizumab. The greater the level of preservation of both layers at the beginning of the study, the higher the response density achieved in the foveola

