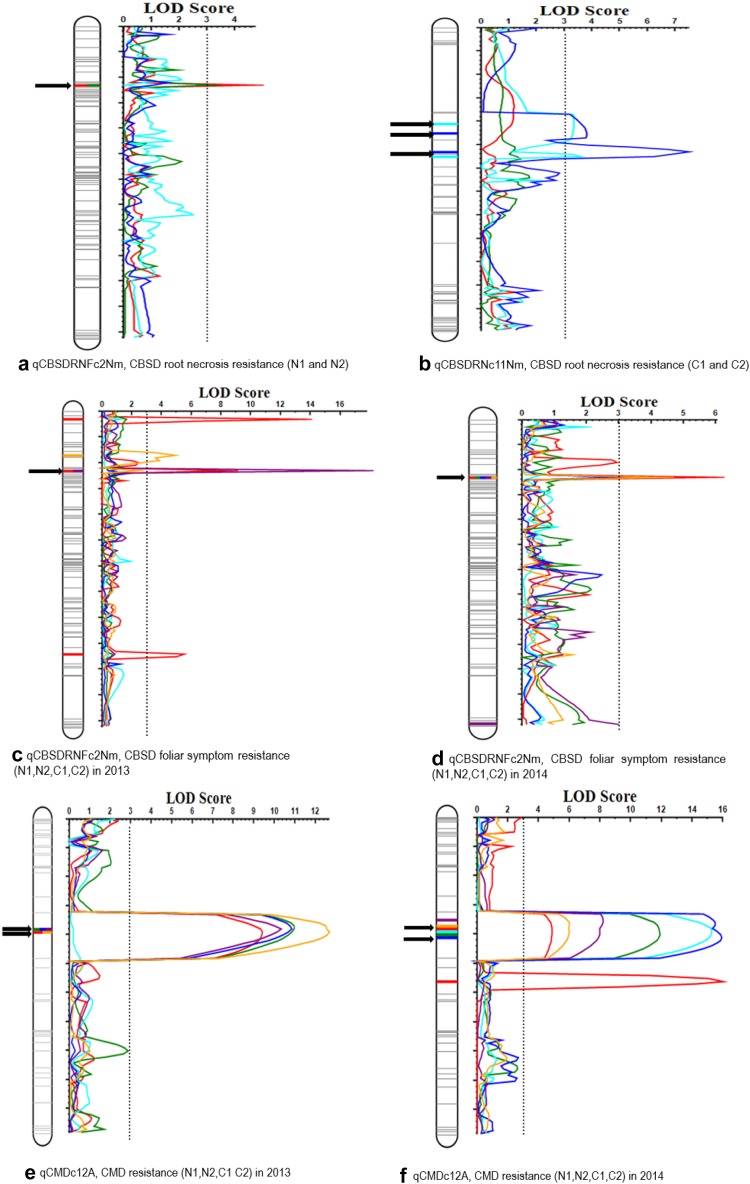
Fig. 2.
GACD LOD profile showing major QTL associated with resistance to CBSD root necrosis a qCBSDRNFc2Nm (N1 and N2) and b qCBSDRNc11Nm (C1 and C2); CBSD foliar symptoms c qCBSDRNFc2Nm (N1 and C1) and d qCBSDRNFc2Nm (N2 and C2); CMD symptoms e qCMDc12A (N1 and C1) and f qCMDc12A (N2 and C2). Arrows point to the QTL position

