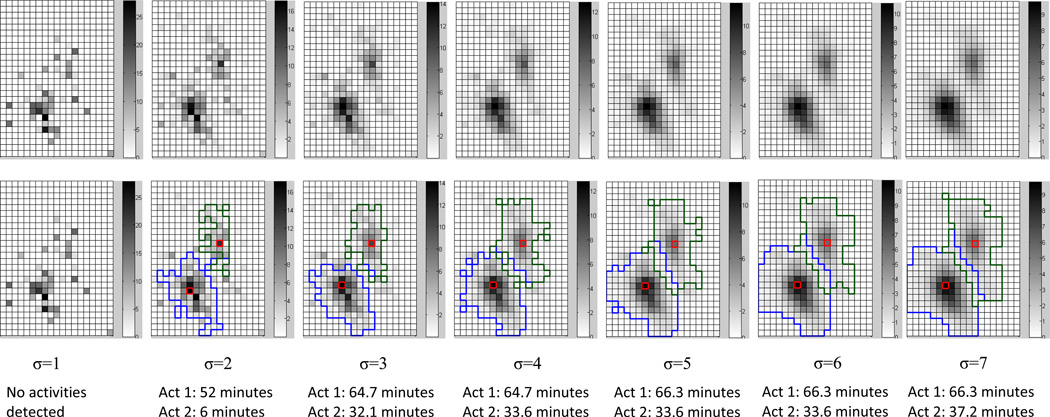
Figure 7.
Spatio-temporal clusters detected at different levels of smoothing. The upper image for each σ value represents the smoothed cells, and the lower image depicts the extent of the detected spatio-temporal clusters, which are used to represent sub-locations. The cluster depicted by the blue boundary represents the first staying activity in building A shown in Figure 1; the cluster depicted by the green boundary represents the second staying activity in building B. The red cell denotes the cluster center. The duration of each activity is calculated using the k-neighborhood point aggregation method.

