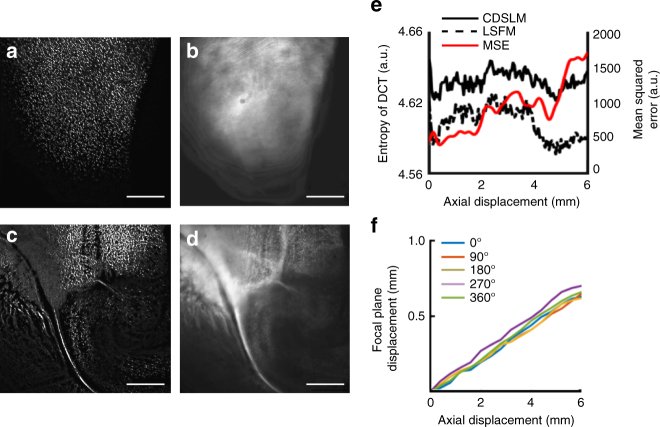
Fig. 2.
Quantification of signal-to-noise enhancement from cleared tissue. Cleared tissue digital scanned light microscopy (C-DSLM) was implemented with a ×4, NA 0.2 detection objective. The light-sheet full-width at half-maximum (FWHM) was adjusted to ∼16 μm to yield an approximate Rayleigh length of 1600 μm before Gaussian beam scanning. Each axial step was ∼3 μm. a−d C-DSLM a, c and standard light-sheet fluorescence microscopy (LSFM) b, d imaging of individual focal planes 1 mm (top-a, b) and 6 mm c, d into the stack. C-DSLM clearly delineated individual oligodendrocyte cells and myelin tracks that were either out-of-focus or blurred due to first-order defocus in standard LSFM (scale bars—500 μm). e Quantification of Shannon Entropy of the Discrete Cosine Transform (SE-DCT) for C-DSLM and standard LSFM as well as mean squared error (MSE) comparison between C-DSLM and standard LSFM throughout the entire image stack. f Quantification of first-order defocus in standard LSFM as a function of axial imaging depth. The sample was imaged at 0°, 90°, 180°, 270°, and 360° fixed rotations. Representative of n = 10 experiments. All imaging was done within the cortex or olfactory bulb of passive CLARITY (PACT) cleared proteolipid-promoter eGFP (PLP-eGFP) mouse tissue

