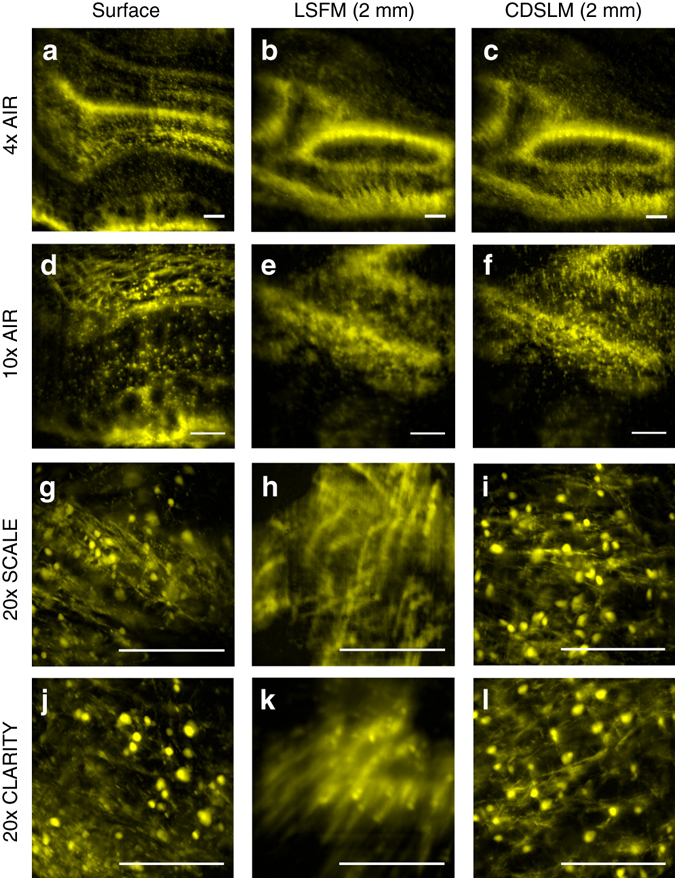
Fig. 3.

First-order defocus correction. Images were acquired using a−c ×4, NA 0.2, refractive index (RI) = 1.0; d−f ×10, NA 0.28, RI = 1.0; g−i ×20, NA 1.0, RI = 1.38; and j−l ×20, NA 1.0, RI = 1.45 detection objectives. All images were obtained from the same passive CLARITY (PACT) cleared proteolipid-promoter eGFP (PLP-eGFP) olfactory bulb region. The light-sheet full-width at half-maximum (FWHM) and excitation electro-tunable lens (ETL-1) limits for Gaussian beam scanning were adjusted to yield the best signal-to-noise for individual objectives. Cleared tissue digital scanned light-sheet microscopy (C-DSLM) clearly delineated individual oligodendrocyte cells and myelin tracks that were either out-of-focus or blurred due to first-order defocus in standard light-sheet fluorescence microscopy (LSFM) for all objectives. Because of differences in RI environment and depth-of-field for individual objectives, the magnitude of the first-order defocus differs in each case. (all scale bars—250 μm)
