
Fig. 5.
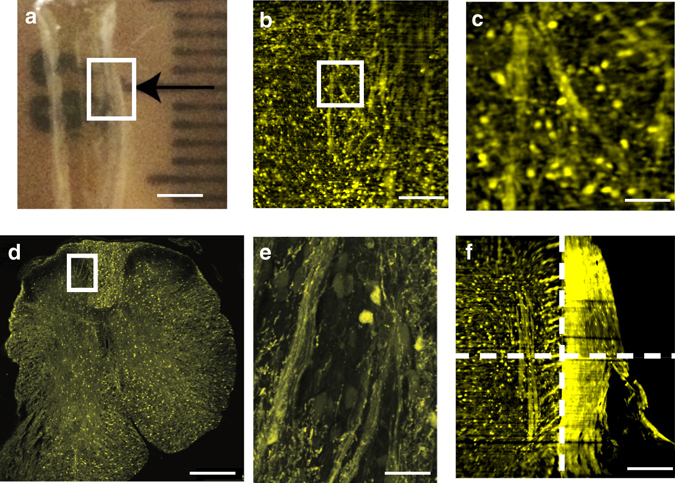
Cleared tissue digital scanned light-sheet microscopy (C-DSLM) imaging of proteolipid-promoter eGFP (PLP-eGFP) mouse spinal cord. a PLP-eGFP mouse spinal cords were passive CLARITY (PACT) cleared in the same manner as PLP-eGFP brain sections. Each black tick of the ruler is 1 mm. Area tiled using C-DSLM is shown by the white box. (scale bar—2.5 mm) b Individual image plane within PLP-eGFP mouse spinal cord from a 1.3 mm × 1.3 mm × 6 mm axial image (scale bar—250 μm) acquired using ×10, NA 0.28 detection objective. The light-sheet full-width at half-maximum (FWHM) was adjusted to ∼10 μm to yield an approximate Rayleigh length of 700 μm before Gaussian beam scanning. Each axial step was ∼1 μm. c Expanded image of highlighted area (white box) in b showing individual cells and myelin fibers (scale bar—50 μm). Supplementary Movie 2 shows a volumetric rendering of this region. d Tiled confocal image of 30 μm axial serial section of uncleared PLP-eGFP spinal cord (×20, NA 0.95 water-immersion objective) (scale bar—250 μm). e Expanded view of highlighted area (white box) in d showing individual cells and myelin fibers (scale bar—50 μm). f To investigate large-scale network connectedness we tiled images over a 4 mm × 3 mm in-plane region, 5 mm out-out-plane region, with individual images (1.3 mm × 1.3 mm in-plane, 5 mm out-of-plane) overlapping images by 25% in each area. Dashed lines delineate independent volumes used for final tiled image (scale bar—100 μm). Supplementary Fig. 2 shows network identification in this tiled volume. Supplementary Movie 3 shows volumetric rendering of the tiled image in f, well matching the confocal image presented in d. Supplementary Movie 4 shows a plane-by-plane rendering of the image in c. These images and analyses are representative of five experiments for spinal cords isolated from different animals