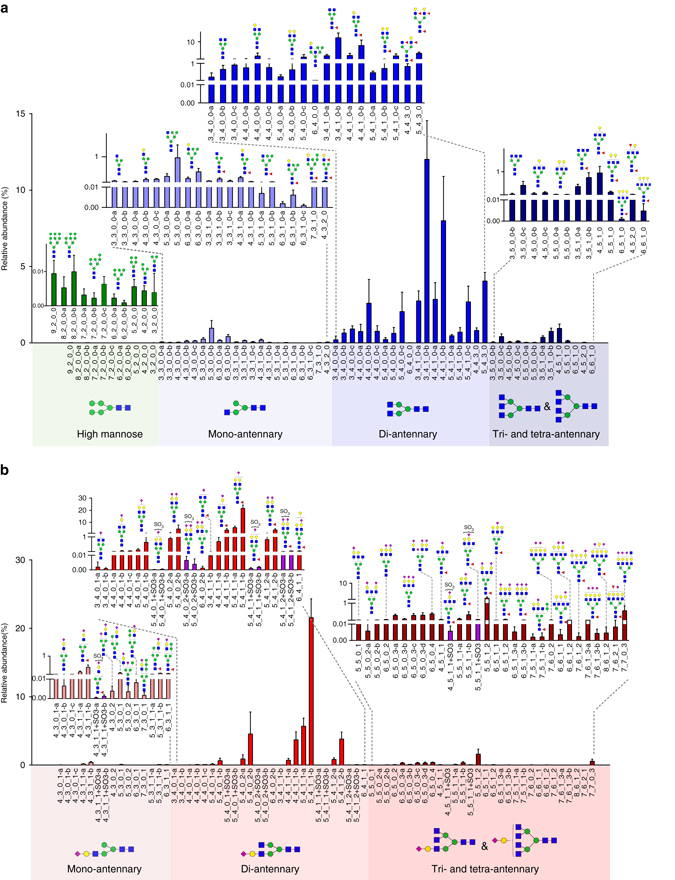
Fig. 6.

Glycomic analysis of human serum IgGs using MRM method. It revealed a highly dynamic range of up to five orders of magnitude in the relative abundances of both neutral a and acidic b N-glycans, data are shown as mean ± s.d

Glycomic analysis of human serum IgGs using MRM method. It revealed a highly dynamic range of up to five orders of magnitude in the relative abundances of both neutral a and acidic b N-glycans, data are shown as mean ± s.d