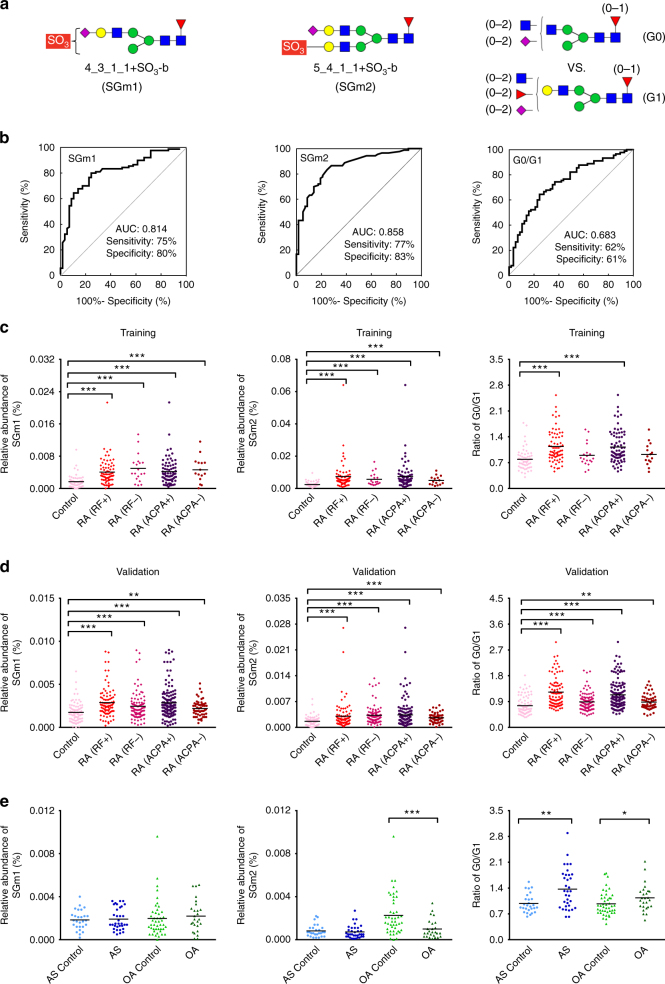
Fig. 7.
Performance and relative abundances of the potential N-glycan biomarkers for RA. a Symbols depicting N-glycan biomarkers identified in current study (SGm1 and SGm2) and that reported previously (G0/G1). b The ROC curve of the biomarkers for the classification of RA (n = 90) and healthy individuals (n = 57). The results are plotted for the training set. c, d The scatter plot of the relative abundance of the N-glycan biomarker in control individuals (training set: n = 57, validation set: n = 84), RF-positive [RA (RF+)] (training set: n = 71, validation set: n = 90) and RF-negative [RA (RF−)] RA patients (training set: n = 19, validation set: n = 97), as well as ACPA-positive [RA (ACPA+)] (training set: n = 75, validation set: n = 132) and ACPA-negative [RA (ACPA−)] RA patients (training set: n = 15, validation set: n = 55), in training set and validation set. e The scatter plot of the relative abundance of the N-glycan biomarkers in AS patients (n = 34), OA patients (n = 26) and in controls of each (AS: n = 27, OA: n = 45). Horizontal lines indicate the median. Statistical analysis was performed by non-parametric Mann–Whitney test, two-sided (*P < 0.05, **P < 0.01, ***P < 0.001)

