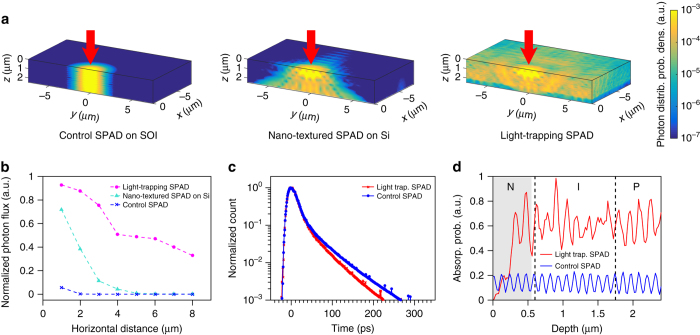
Fig. 2.
Simulation of photon distribution probability and jitter performance. a FDTD simulation of 850 nm wavelength photon distribution in a control SPAD (left), nano-textured SPAD on Si substrate (middle), and light-trapping SPAD (right). Photons are incident in positive Z direction. The color bar on the right shows the color map of photon distribution probability density. b Normalized flux of 850 nm photons propagating varying horizontal distance in a control SPAD (blue cross), nano-textured SPAD on Si substrate (turquoise triangle) and light-trapping SPAD (magenta circle). c Monte Carlo simulation of jitter distribution at given photon absorption distribution for a control SPAD (blue) and light-trapping SPAD (red). d Simulated photon absorption at varying depths for a control SPAD (blue) and light-trapping SPAD (red), with top surface at 0 μm. Shaded areas correspond to regions being nano-structured. Dashed lines denote respective doping layer in an NIP junction from left (surface) to right (substrate)

