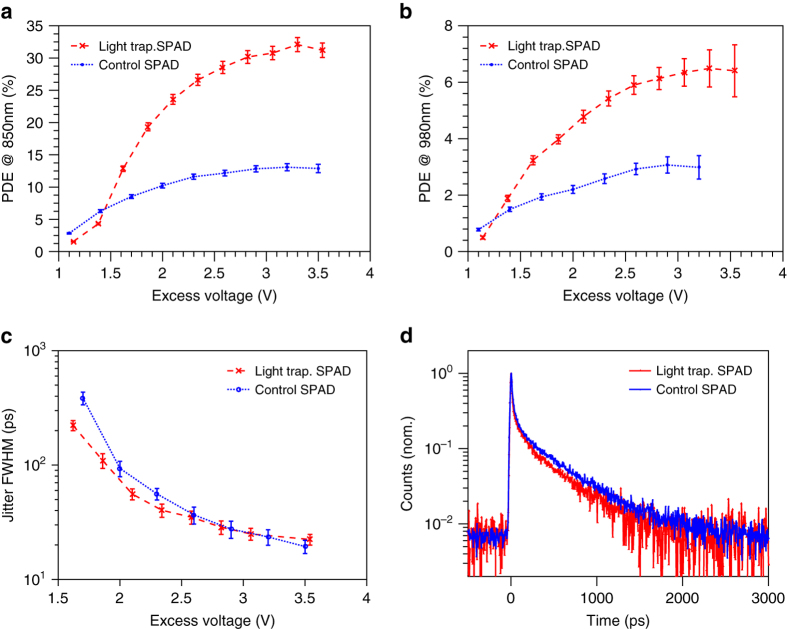
Fig. 4.
Single photon measurements. In all figures, blue stands for control SPADs and red for light-trapping SPADs. The error bars in a–c are estimated measurement uncertainty (see Supplementary Notes 3 and 4 for uncertainty analysis). a PDE vs. excess voltage at 850 nm wavelength, error bar, s. d. b PDE vs. excess voltage at 980 nm wavelength, Error bar, s.d. c Jitter (FWHM) vs. excess voltage at 940 nm and 1 photon per pulse, error bar, s.d. d Jitter distribution of two SPADs at 940 nm wavelength with FWHM of 25 ps, measured at 1 photon per pulse and corrected for pile-up effect

