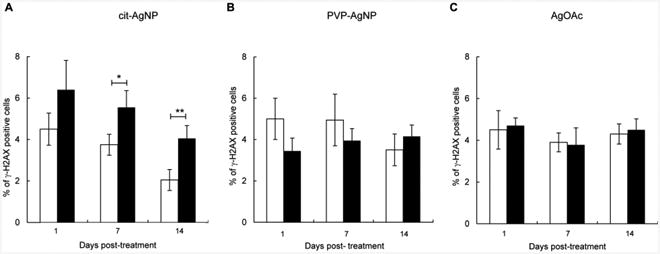
Fig. 3. Induction of DSBs by AgNPs and Ag+ at 1 day, 1 week and 2 weeks after treatment.

(A) Levels of γ-H2AX foci in mice treated with citrate-coated AgNPs. (B) Levels of γ-H2AX foci in mice treated with PVP-coated AgNPs. (C) Levels of γ-H2AX foci in mice treated with AgOAc. Filled bars show treated mice and open bars show respective controls. Mean ± SEM is shown, n = 10 mice/group, *p ≤ 0.05, **p ≤ 0.01 compared to controls.
