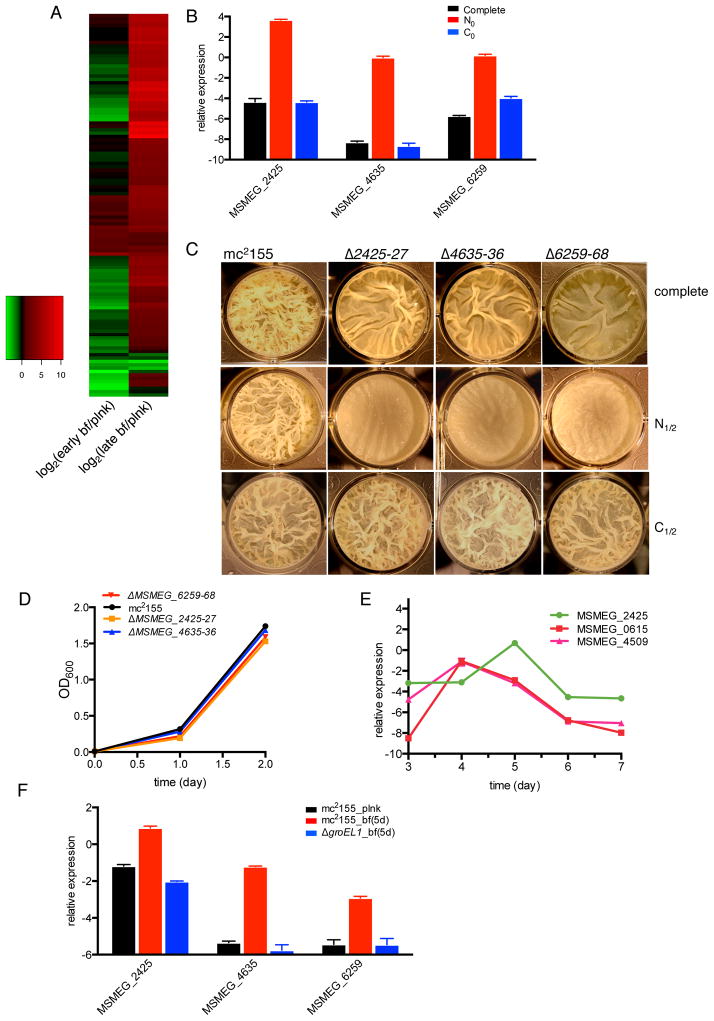
Figure 6. Genes with restored expression in the Δlsr2/Δmps suppressor are induced during maturation of mc2155 biofilms.
A. Heat map depicting difference in expression levels of 111 genes, which are decreased in a Δlsr2 strain but restored in a Δlsr2/Δmps strain (Table S4). Expression of genes was measured in early and late biofilms (bf) of mc2155, and compared to their basal levels in a planktonic (plnk) culture of the strain. 83 of these genes are expressed exclusively in late-stage biofilms (see the list in Table S6). B. Expression of three amt genes (amt1; MSMEG_ 2425, amt2; MSMEG_4635 and amt3: MSMEG_6259) in planktonic mc2155 cells after 3 hours of incubation in N0, or C0 variations of biofilm (bf) medium, free of primary sources of nitrogen and carbon, respectively. C. 5-day biofilms of the wild-type and indicated mutants in N1/2 or C1/2 variations of complete bf medium containing half the amounts of these nutrients. The mutants are denoted with their respective MSMEG_ numbers. D. planktonic growth of wild-type and mutants shown in panel C in N1/2 biofilm medium. E. Expression of Fe sequestering genes (MSMEG_0615 and MSMEG_4509) and amt1 during biofilm growth of mc2155 at the indicated time post inoculation. F. Comparison of expression of the amt genes in planktonic (plnk) and 5-day (5d) biofilms (bf) of wild-type and ΔgroEL1 cells. All expression levels were determined by RT-qPCR and Ct values were normalized using the sigA transcript. Data in panels B, D, E and F represent mean ± SD, n = 3.

