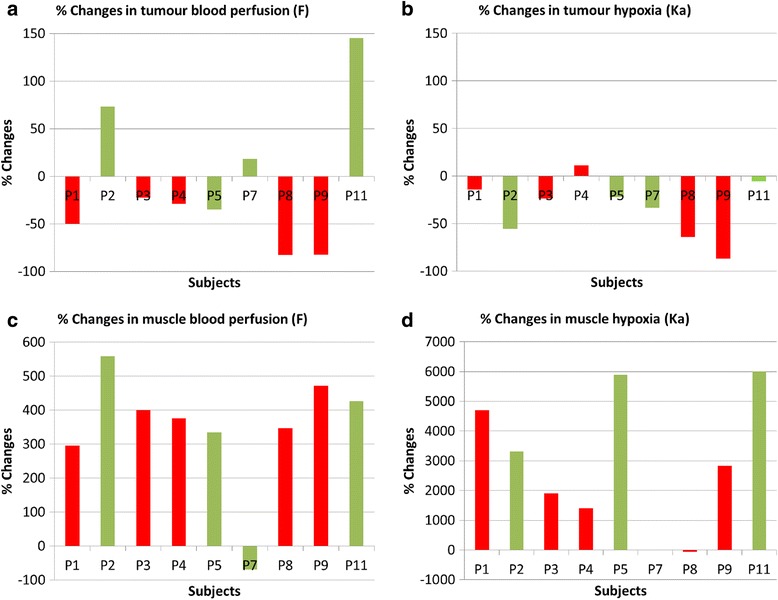
Fig. 2.

Percentage changes in tumour blood perfusion (a), tumour hypoxia (b), muscle blood perfusion (c) and muscle hypoxia (d) between baseline and after 8–10 fractions of CRT from fitting 0-45 min [18F]FMISO PET data to Casciari model. The red bars show non-responders and the green bars show responders. [18F]FMISO = [18F]fluoromisonidazole; PET = positron emission tomography; CRT = chemoradiotherapy; % = percentage; min = minutes
