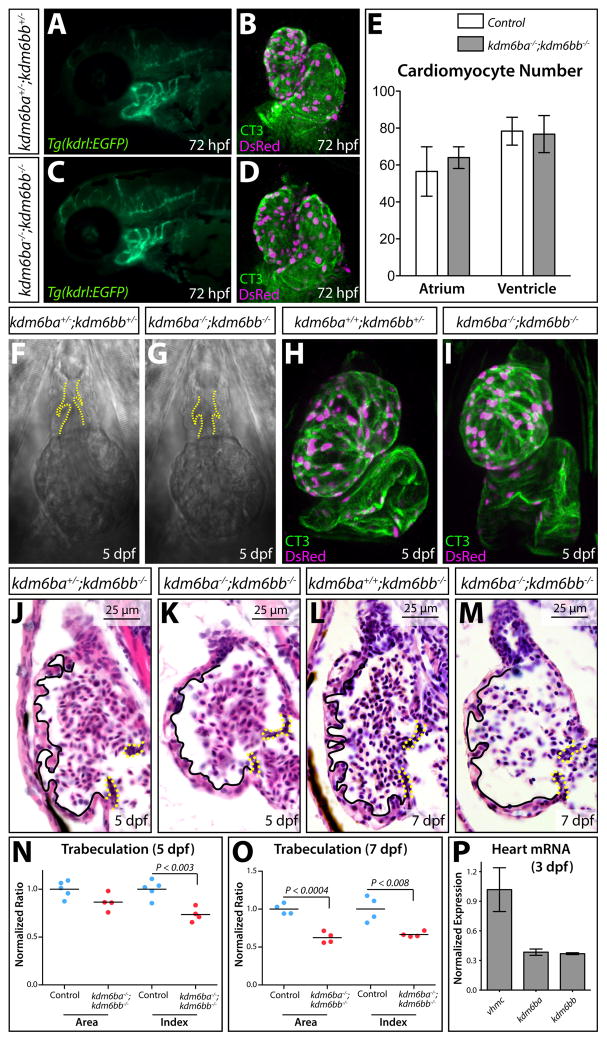
Figure 4. Kdm6ba and kdm6bb redundantly promote cardiac trabeculation.
(A, C) Fluorescent imaged whole mount 72 hpf embryos showing the aortic arch arteries of control and kdm6b-deficient Tg(kdrl:EGFP) animals. (B, D) Confocal heart images of whole mount 72 hpf Tg(myl7:DsRed-nuc) larvae antibody stained for DsRed (red, cardiomyocyte nuclei) and cardiac troponin (CT3, heart muscle). Control and combined kdm6ba/kdm6bb-deficient larvae are shown. (E) Bar graphs comparing the absolute number of atrial and ventricular cardiomyocytes between 72 hpf control (kdm6ba+/−; kdm6bb+/− and kdm6ba+/+; kdm6bb+/−) and kdm6ba−/−; kdm6bb−/− larvae. Error bars represent one standard deviation (n=6 control and 7 kdm6ba/bb-deficient fish from two clutches). (F, G) DIC microscopy images showing the OFT and ventricle of control and kdm6b-deficient embryos at 5 dpf. Dashed yellow lines outline the OFT valves. (H, I) Whole mount confocal imaged hearts of immunostained 5 dpf control and kdm6ba−/−; kdm6bb−/− larvae. These Tg(myl7:DsRed-nuc) fish are stained with anti-DsRed (red, cardiomyocyte nuclei) and anti-cardiac troponin (CT3, green) antibodies. (J–M) H&E stained sagittal sections through the heart of 5 and 7 dpf control and kdm6ba−/−; kdm6bb−/− larvae. Solid lines outline the trabeculae and dashed yellow lines indicate the AVC valves. (N, O) Scatterplot graphs showing the normalized outer curvature ventricular sectional area and trabeculation extent (“index”) of 5 and 7 dpf control compared to clutch mate kdm6ba−/−; kdm6bb−/− larvae. Each data point represents one animal. P-values are from Student’s two-tailed t-tests. (P) Bar graph of qRT-PCR data comparing kdm6ba and kdm6bb to vmhcl transcript levels using three pools of isolated 3 dpf zebrafish embryonic hearts (normalized to vmhcl levels). Error bars are one standard deviation.

