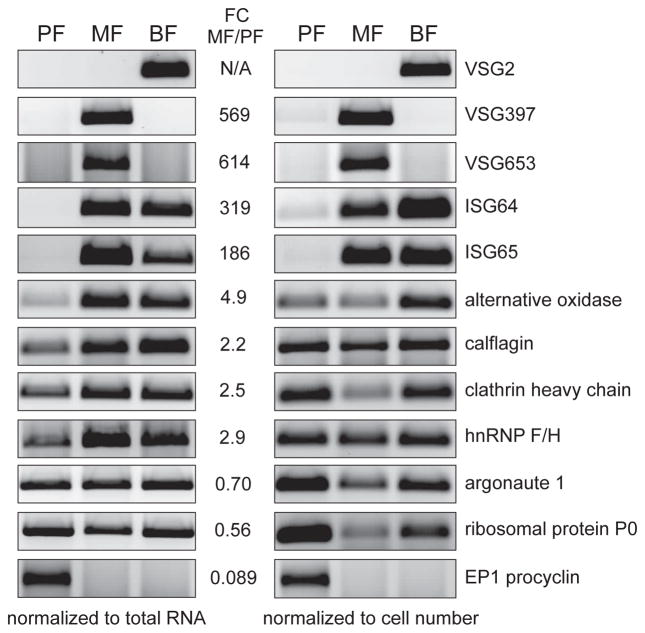
Figure 2. Selected examples of mRNAs changing in abundance between MF and PF.
Semi-quantitative RT-PCR confirmation of RNA-Seq data using equal amount of total RNA per sample (left) or equal number of trypanosomes per sample (right). Inverted images of EtBr-stained agarose gels are shown. Listed are the RNA-Seq fold-change values obtained by the DESeq2 analysis (see Experimental Procedures).

