
Figure 5. Effects of TD-1 on the levels of ferryl hemoglobin formation.
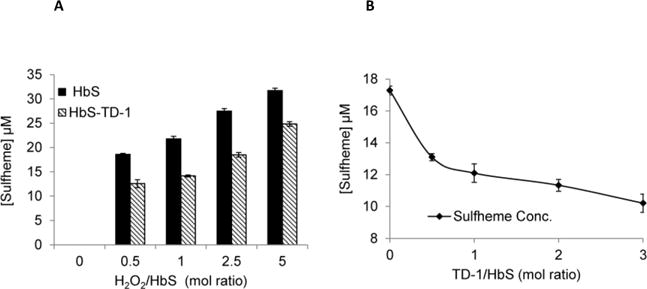
(A) Calculated values for sulfHb using extinction coefficient are plotted in a bar graph; non-treated HbS (solid black) and TD-1 treated (pattern). (B) Calculated values of sulfHb of HbS treated with various concentrations of TD-1 (30 μM, 60 μM, 120 μM or 180 μM TD-1); sulfheme concentration versus TD-1 ratio to Hb was plotted.