
Figure 6. Reversed HPLC analysis of TD-1 treated HbS.
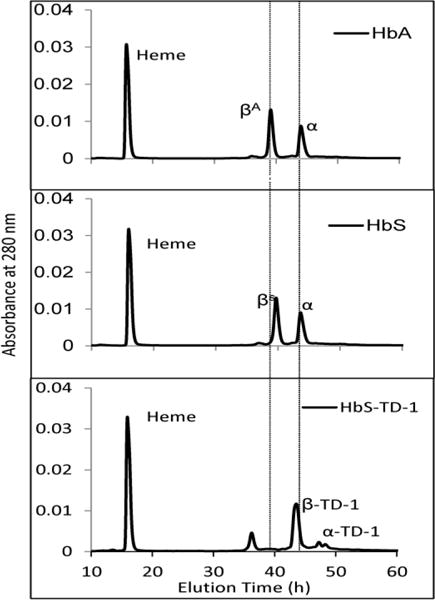
Hb (25 μg) was injected into C3 column. HbS (60 μM) was incubated with TD-1 (120 μM) for 15 min at 37 °C. The mobile phase consisted of (A) 0.1% TFA in water and (B) 0.1% TFA in acetonitrile. A gradient was programmed to deliver 65% (A)/35% (B) to 53% (A)/47 %(B) over 80 minutes. Solvents were mixed and run at a rate of 1 mL/min and absorbance was monitored at 280 nm and 405 nm. Control HbA and HbS monitored at 280 nm are shown on first and second panels, respectively, with β and α globin chains. The bottom panel shows the profile of HbS treated with TD-1.