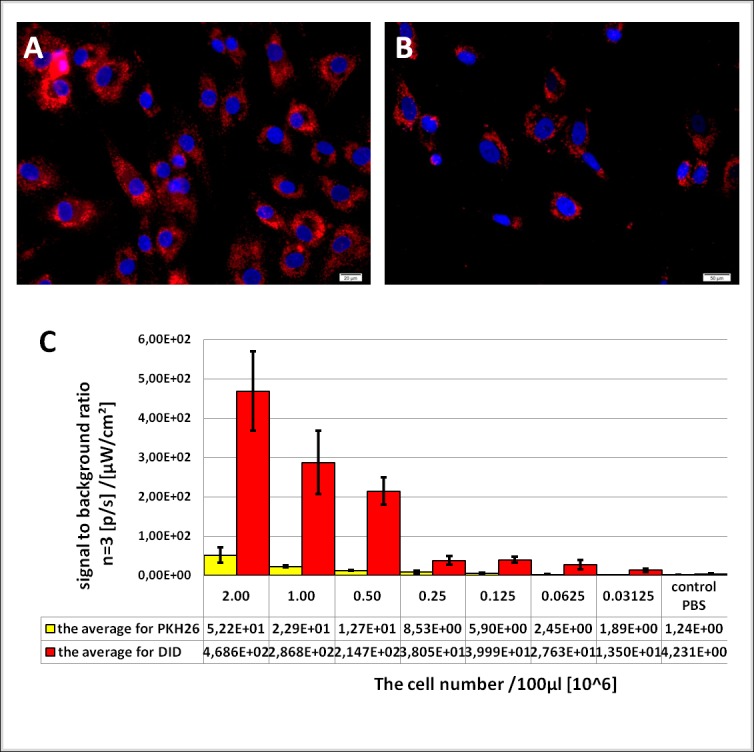
Fig 2. Evaluation of the cell staining effectiveness and strength of fluorescence signal for the transplantation procedure and in vitro experiment.

Fluorescence microscopy pictures: A) cells labeled with PKH 26 (red fluorescence), B) cells labeled with DID (red fluorescence). Nuclei were labeled with DAPI (blue). C) Graph showing strength of fluorescence signal from PKH26 (yellow) and DID (red) labeled cells relative to background fluorescence. The measurements were performed for subsequent decreasing number of cells in triplicates. Data presented as averages +/- standard deviations.
