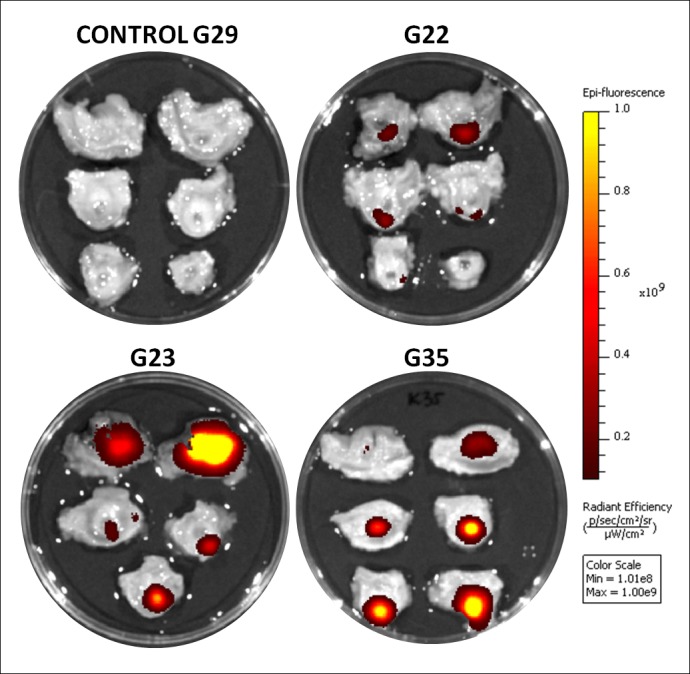
Fig 4. Images of representative urethras from control and experimental groups analyzed with IVIS® for the presence of DID labeled cells obtained by manual alignment of the spectrum.

The color scale bar shows the range of strongest to weakest signal (1.01x10⁸- 1.00x10⁹). The intensity is strongest for the yellow colored points. The darker the spot, the weaker the signal; Ex. G22- experimental goat number.
