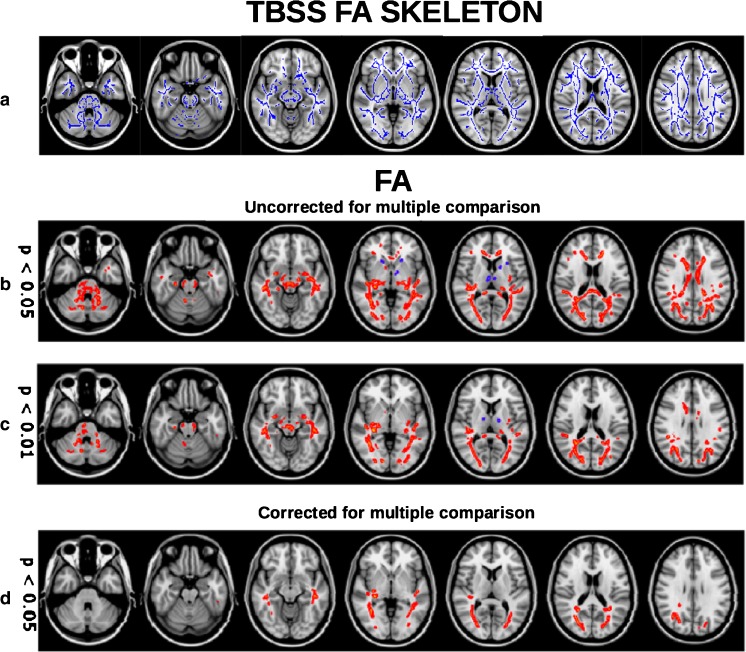
Fig. 4.
TBSS analysis of patients’ fiber tracts in patients with NMOSD compared to healthy controls. a TBSS mean FA skeleton of patients and healthy controls. b–d FA differences between NMOSD patients and healthy controls at p values uncorrected for multiple comparisons p < 0.05 (b) and p < 0.01 (c), and at a p < 0.05 fwe corrected for multiple comparisons (d). Red-yellow = reduction in NMOSD patients/blue-light blue = increase in NMOSD patients. For visualization purposes, significant skeleton tracts are thickened (tbss_fill script of fsl). b–d Are images reproduced from Pache F, Zimmermann H, Finke C, et al. (2016) Brain parenchymal damage in neuromyelitis optica spectrum disorder—a multimodal MRI study. Eur Radiol 26: 4413–4422. [84]

