
Fig 2. Association between IL-17 positive cells and bladder cancer grade and stage.
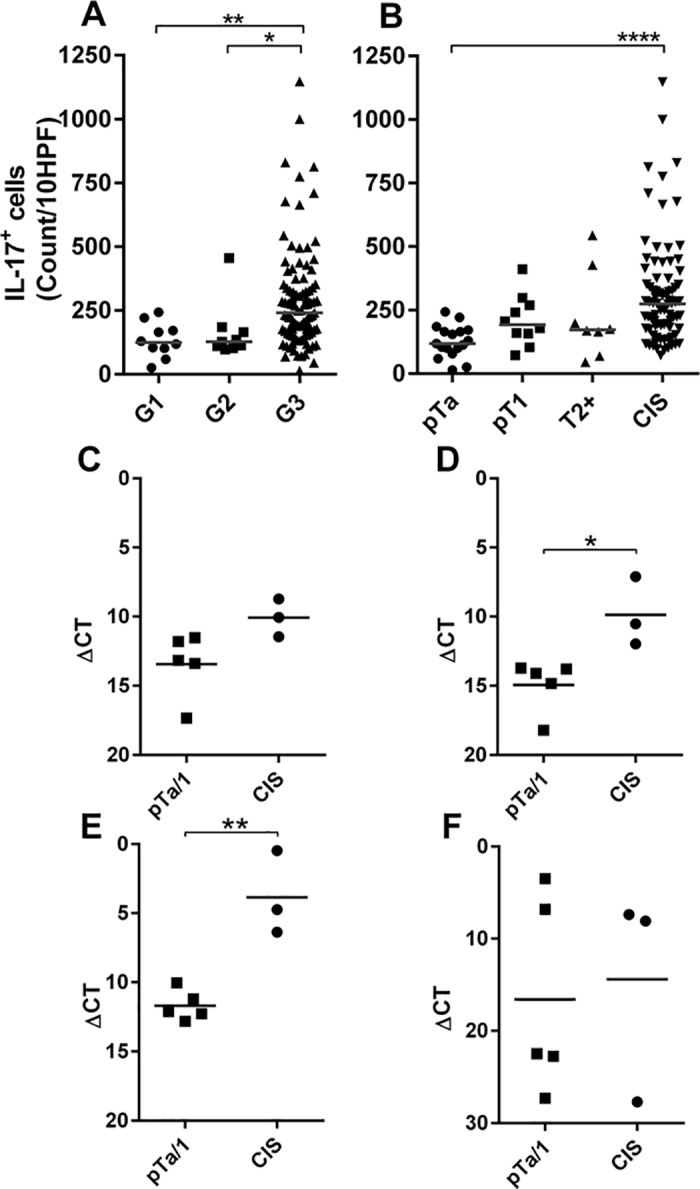
Upper panels: The number of IL-17 positive cells present in different bladder cancer biopsies are displayed according to (A) grade at time of diagnosis (G1, n = 10; G2, n = 9; G3 n = 95) or (B) stage at time of diagnosis (pTa, n = 17; pT1, n = 10; T2+, n = 8; CIS, n = 83). Horizontal bars indicate the mean number of cells present in all biopsies within each subgroup. Lower panels: Results of quantitative rtPCR measuring RNA transcripts present in whole snap frozen biopsies diagnosed as stage pTa/pT1(n = 5) or pTa/pT1 with concomitant CIS (n = 3). The ΔCT values of mRNA transcripts of (C) IL-17A, (D) IL-17-F, (E) IL-6 or (F) IL-23 are shown relative to GAPDH (ΔCT = CTExperimental-CTGAPDH). Asterisks indicate significance calculated by one way ANOVA with Dunn’s multiple comparison test (B) or unpaired T-test (C-F): *p<0.05, **p<0.01, ****p<0.0001, n/s = not significant.