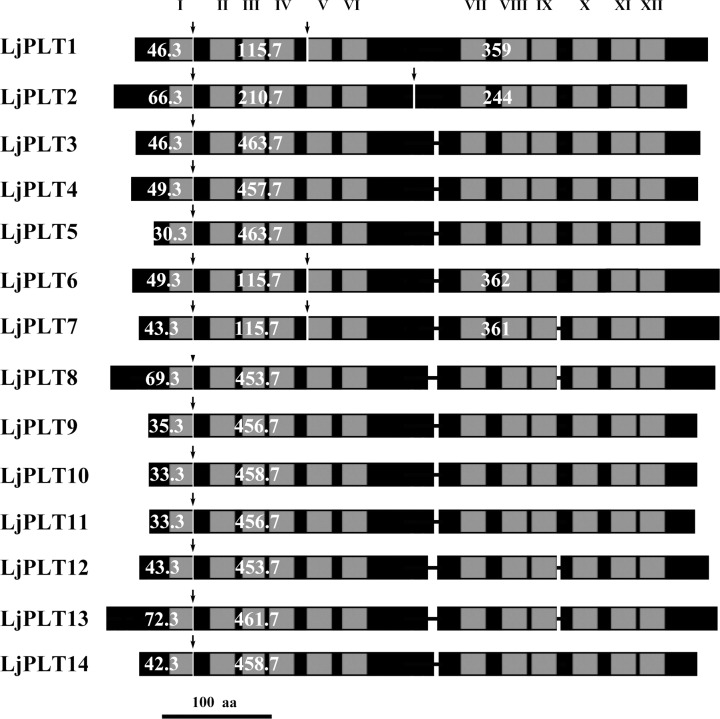
Fig 1. Comparison of the 14 LjPLT proteins.
Schematic alignment of the deduced protein sequences (boxes) of LjPLT1 to LjPLT14 based on the positions of intron (arrows) in these genes. Grey boxes (I–XII) indicate the positions of transmembrane helices as predicted by the HMMTOP software package. Thin lines show small gaps in the sequences. Numbers of amino acids encoded by the different exons are indicated (white).

