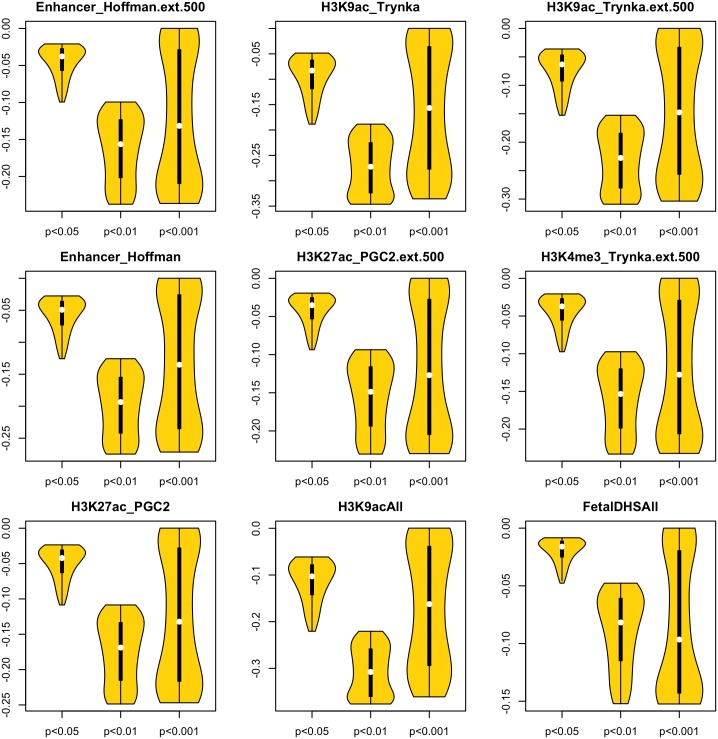
Fig 2. Changes in LFDR estimates between unadjusted LFDR and LFDR estimated with the ME method, when each of nine functional annotations are used to define a high risk subset of SNPs.
Within each panel, the three distributions are divided by p-value ranges: unadjusted p<0.05; unadjusted p<0.01; unadjusted p<0.001.

