Figure 1.
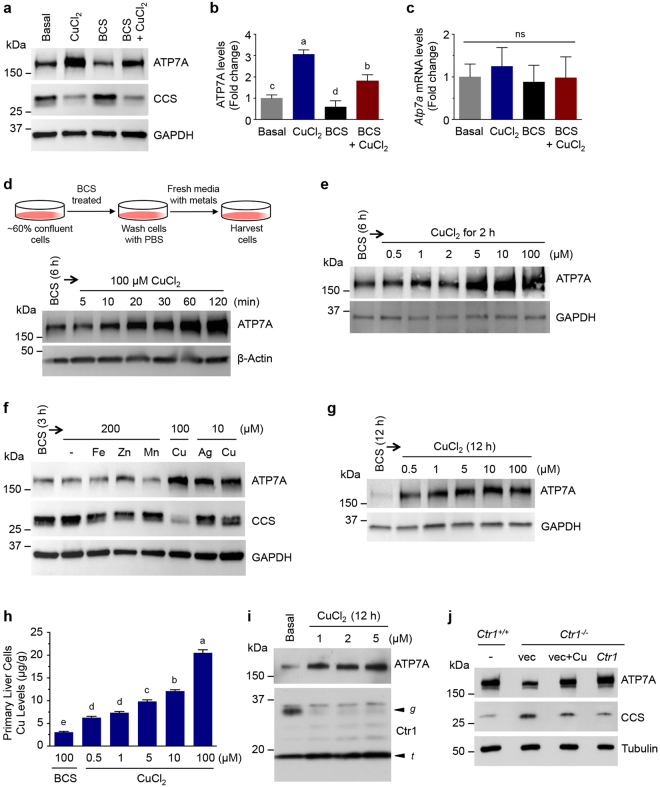
Elevated Cu increases ATP7A protein levels in cultured cells. (a) IEC-6 cells were exposed to basal medium, 100 µM CuCl2 for 3 h, 300 µM BCS for 6 h, or 300 µM BCS plus 100 µM CuCl2 for 6 h. Total protein extracts were probed with an anti-ATP7A antibody, anti-CCS, and anti-GAPDH as a loading control. A representative immunoblot of seven independent experiments is shown here. (b,c) Relative expression levels of ATP7A protein (b) and Atp7a mRNA (c) in IEC-6 cells exposed to CuCl2, BCS, or BCS with CuCl2 were normalized to basal media conditions from four independent immunoblot and RT-qPCR experiments. GAPDH protein and 18S rRNA mRNA, respectively, were used as internal controls in these experiments. Error bars indicate mean ± SD of four independent experiments. Means that do not share a letter are significantly different (P < 0.05); ns, not significant (P > 0.05) (one-way ANOVA, Tukey’s post hoc test). (d,e) IEC-6 cells at ~60% confluence were preincubated with 300 µM BCS-treated medium for 6 h to minimize expression levels of ATP7A. Cells were further supplemented with 100 µM CuCl2 for the indicated time (d) or with the indicated Cu concentrations for 2 h (e). β-actin and GAPDH levels shown in the lower panel demonstrate equal protein loading. Data are representative of two (d) and three (e) independent experiments. (f) IEC-6 cells were preincubated with 300 μM BCS for 3 h before switching to media containing 200 µM of FeCl3 (Fe), ZnCl2 (Zn), MnCl2 (Mn), 10 µM of AgNO3 (Ag), or 10 or 100 μM of CuCl2 (Cu) for 2 h, and 100 μg of protein extracts were subjected to immunoblotting. Reduced levels of CCS indicate increased bioavailable Cu levels, and GAPDH levels are shown to indicate protein loading of samples. Immunoblots are representative results of four independent experiments. (g) Mouse primary liver cells treated with Cu supplementation were analyzed by immunoblotting. Mouse liver cells were pretreated for 12 h in BCS-containing medium and then exposed to medium containing indicated concentrations of CuCl2 for additional 12 h. GAPDH levels were assayed as a loading control. Immunoblots are representative results of four independent experiments. (h) Total Cu levels in mouse primary liver cells were measured by ICP-MS upon supplementation with 100 µM BCS or the indicated Cu concentrations. Data are presented as mean ± SD from four biological replicates. Values with one different letter are significantly different from each other (P < 0.05) (One-way ANOVA, Tukey’s post hoc test). (i) Immunoblotting of ATP7A and Ctr1 levels in HUVEC cells treated with a range of concentrations of CuCl2 for 12 h. The arrowheads labeled g and t indicate the full-length glycosylated monomer and the amino-terminal truncation forms of Ctr1, respectively. The glycosylated and truncated form of Ctr1 have previously been demonstrated to represent mature glycosylated Ctr1 species, and amino-terminal cleaved truncated Ctr1, respectively33. Data are representative of three independent experiments. (j) ATP7A protein levels in Ctr1 +/+ and Ctr1 −/− MEFs. Total protein extracts isolated from wild type (Ctr1 +/+) MEFs, Ctr1 −/− MEFs transfected with empty vector (vec) exposed to basal media or 100 μM CuCl2 for overnight (vec + Cu), and Ctr1 −/− MEFs transfected with a plasmid expressing Ctr1 were resolved by SDS-PAGE and analyzed by immunoblotting. Data are representative for three independent experiments. Full-length blots are presented in Supplementary Figure 11.

