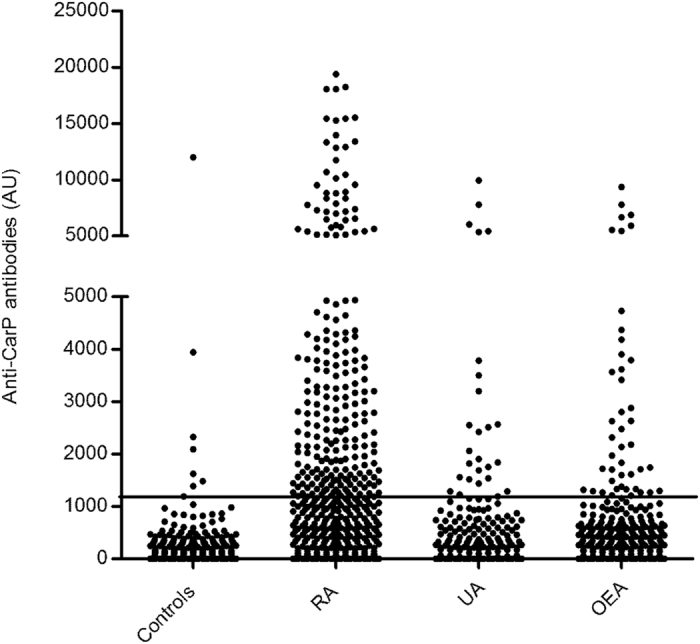
Figure 1.

Titers of anti-CarP antibodies in the EA patients and healthy controls. The EA patients were stratified according with their classification at the end of the two year follow-up in RA, undifferentiated arthritis (UA) and other EA (OEA). Each dot represents the anti-CarP titer of a subject. The horizontal line is the threshold for positivity. The Y axis break separates two sections with different scaling without solution of continuity.
