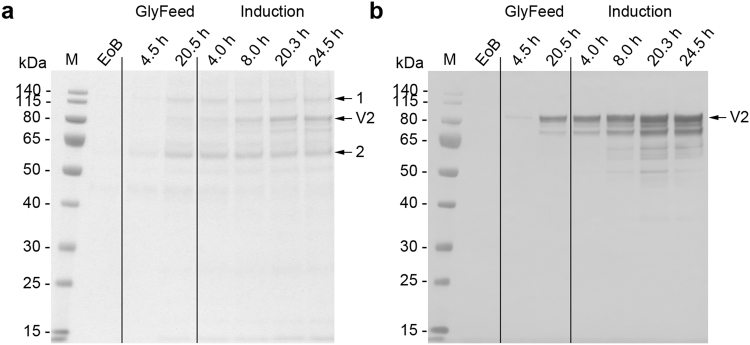
Figure 6.
Analysis of fermentation supernatants during the three-phase fermentation process for the production of VAMAX2. (a) Proteins in 15 µL supernatant were separated by LDS-PAGE and stained with SimplyBlue SafeStain. Numbered arrows indicate two impurities that were more abundant in the supernatant when the three-phase strategy was used instead of the two-phase strategy. (b) The proteins separated above were further analyzed by immunoblotting using the reduction-sensitive mAb 4G2. Times above the lanes indicate the elapsed hours of each process phase. M: protein marker. EoB: end of batch-phase. GlyFeed: glycerol fed-batch phase. Numbered arrows: samples analyzed by mass spectrometry. V2: target protein VAMAX2.

