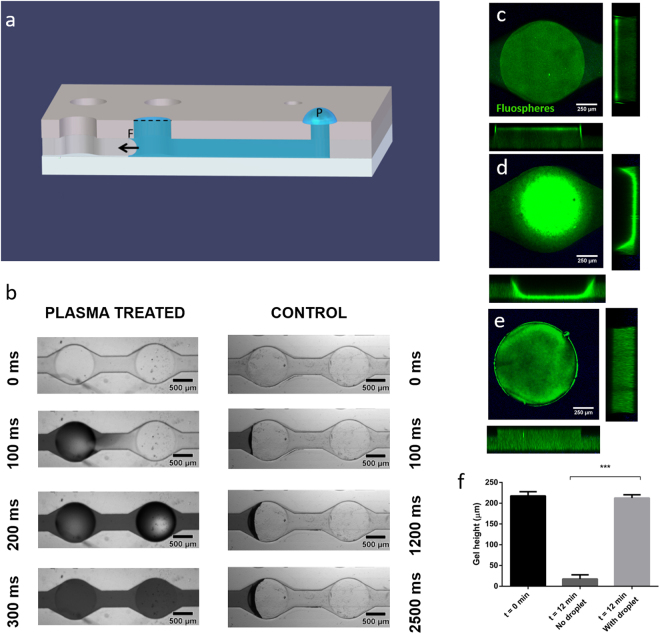
Figure 2.
Air-hydrogel interface analysis and optimization in the microdevice. (a) Schematic representation of the device, showing capillary forces exerted by the geometry, and capillary valves integrated into the design (dotted line). The scheme includes the hydrogel droplet that was placed on the top of the main inlet, to compensate for evaporation issues of the solution in the hydrogel and to ensure the formation of a flat hydrogel-air interface. (b) Influence of the plasma treatment on the microdevice spontaneous filling. Left- Bright-field 20x images showing the filling dynamics of a microdevice after plasma treatment at 0, 100, 200 and 300 ms, respectively; Right- Bright-field 20x images showing the filling dynamics of a microdevice without any plasma treatment at 0, 100, 1200 and 2500 ms, respectively. (c-f) Characterization of the hydrogel-air interface in the microdevice using confocal microscopy. 100x images flanked by z-stack orthogonal views of the gel interface at 0 min after hydrogel introduction (c) and 12 min after introduction of the hydrogel, with (e) or without addition of a droplet of water (d). Water evaporation caused a dramatic contraction of the hydrogel (d) and FluoSpheres® accumulation at the interface, which formed a deep meniscus in the well. (e) Hydrogel polymerized with an additional hydrogel droplet placed on the main inlet during 12 min. No meniscus was observed and the hydrogel-air interface was flat as desired. (f) Quantification of the hydrogel height in the microwells just after introduction of the hydrogel (t = 0 min) and 12 min later, after gel polymerization, when no droplet was added on the inlet (t = 12 min. No droplet) and when a droplet was added on the inlet (t = 12 min with droplet). (***) p < 0.001 as calculated through Kruskal-Wallis after disproving data normality. The graph shows Average ± SEM – N = 10.

