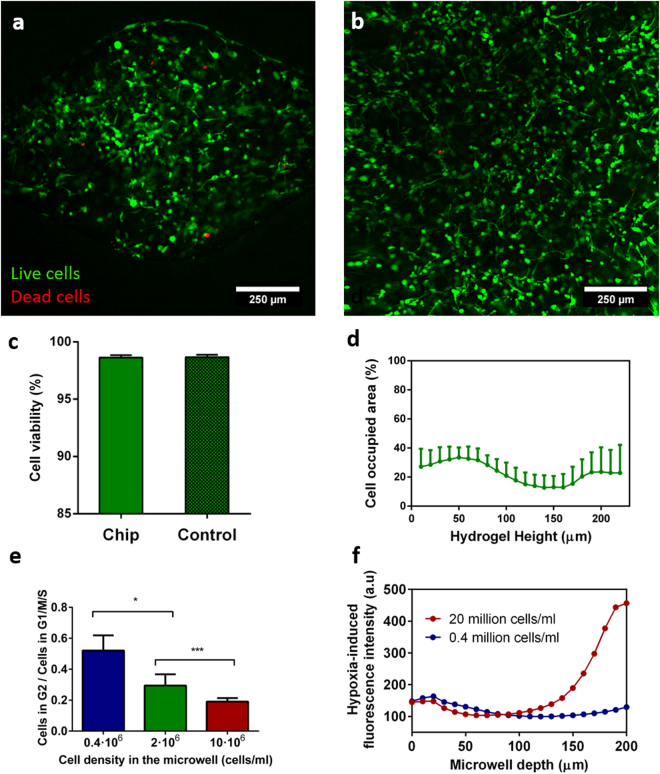
Figure 3.
Viability of the MDA-MB231 cells grown in the microdevice in a 3D hydrogel matrix. Viable cells were stained with Calcein AM (green), whereas dead ones were labelled with propidium iodide (red). (a) 100x confocal image showing the cell viability in one microwell in the device. (b) 100x confocal image of the same cells grown in 2D on a Petri dish (control). (c) Quantification of the MDA-MB-231 cell viability within the microdevice and in Petri dishes. Welch’s t-test was performed for comparison (two-tailed distribution, α = 0.05) and non-significant statistical differences were found (N = 3). (d) Quantification of the cell occupied area as a function of the hydrogel depth. 0 µm refers to the top of the microwell (N = 10). (e) Proliferation index of cells cultured in the hydrogel in the microdevice, calculated by normalizing the number of cells in G2/S/M (as characterized by Premo FUCCI transfection in situ) with the total number of seeded cells. Data analysed by means of Kruskal-Wallis’ Test (N = 3). (***) p-value < 0.0001. (f) Characterization of the oxygen level in the device for different cell densities (0.4·106, 2·106 and 107 cells/ml) using Hypoxia-IT®. All graphs show average ± SEM.

