Figure 5.
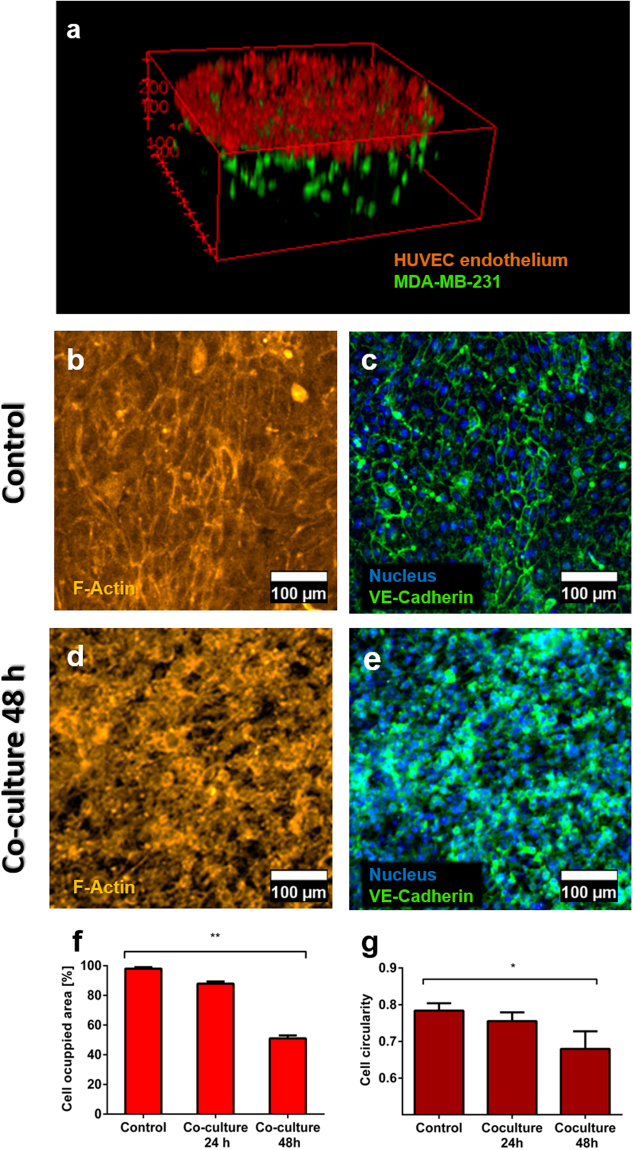
Co-culture of MDA-MB231 tumour cells with HUVECs cells. (a) 3D reconstruction of the 2D-3D co-culture model within the microdevice after 24 h of seeding, tumour cells being grown in the 3D hydrogel matrix and HUVECs as a monolayer on top of the hydrogel in the microwells. (b–g) Assessment of the integrity of the endothelium monolayer in the co-culture system, compared to control conditions (endothelium mono-culture). b- Actin staining of a control HUVEC endothelium (mono-culture). (c) Detail of a control HUVEC endothelium (mono-culture) stained with VE-Cadherin and NucBlue®. (d) Actin staining of a HUVEC endothelium in co-culture with MDA-MB-231 tumour cells, 48 h after cell seeding. (e) Detail of a HUVEC endothelium in co-culture with MDA-MB-231 tumour cells, 48 h after seeding, stained with VE-Cadherin and NucBlue®. (f) Assessment of the integrity of the HUVEC endothelium for the co-culture after 24 and 48 h compared to control conditions (mono-culture of a HUVEC monolayer) quantified as F-actin signal area. (n = 5, p < 0.02 as calculated with Kruskal-Wallis’ Test) (g) Assessment of the HUVEC cell circularity for control (mono-culture) and co-culture conditions after 24 and 48 h. Data was normally distributed and was evaluated by means of one-way ANOVA (n = 20). Graphs show average ± SEM and magnification is 200x for all images.

