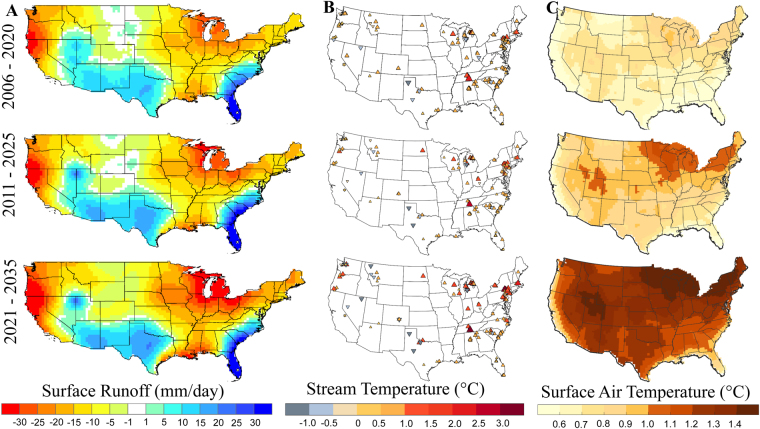
Figure 1.
Spatial profile of water scarcity and stream temperature over near-term projection horizons. (A) Projected changes in low surface runoff (10th percentile of all climate realizations [see Methods]) during 2006–2020 (top), 2011–2025 (middle), and 2021–2035 (bottom), relative to current estimates (1991–2005). Calculations are performed in MATLAB 2015a (Version 8.5, http://www.mathworks.com) [Software]. Shades of blue show positive changes in future freshwater availability relative to current estimates, but they do not necessarily indicate water surplus. (B) Same as in (A) but for projected changes in high stream temperature (90th percentile of all climate simulations). The red (blue)-colored upward (downward) triangles in (B) indicate increase (decrease) in stream temperature. (C) Same as in (A) but for projected changes in 2-meter surface air temperature (90th percentile). Spatial patterns of current estimates are shown in Figures S1, S2 and S4. Maps are generated using MATLAB 2015a (Version 8.5, http://www.mathworks.com) and ArcGIS Desktop (Version 10.3.1, http://www.esri.com). Finally, all these maps are organized and labelled in Adobe Photoshop CS Desktop (Version 5.1, https://www.adobe.com) [Software].

