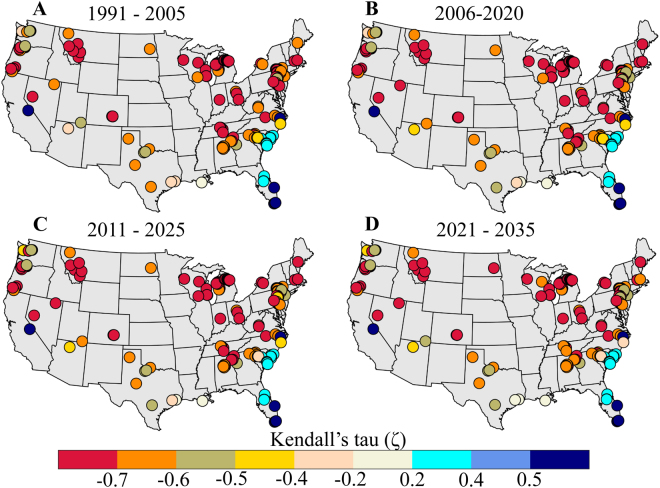
Figure 2.
Association between indicators of water stress. (A–D) Correlation coefficient between monthly surface runoff and stream temperature as measured by Kendall’s tau at 145 USGS gauge stations for (A) current (1991–2005) and (B–D) future time horizons (2006–2035). Correlations are statistically significant at 5% at all gauge stations for both current and future periods. Maps are generated using MATLAB 2015a (Version 8.5, http://www.mathworks.com). Finally, all these maps are organized and labelled in Adobe Photoshop CS Desktop (Version 5.1, https://www.adobe.com) [Software].

