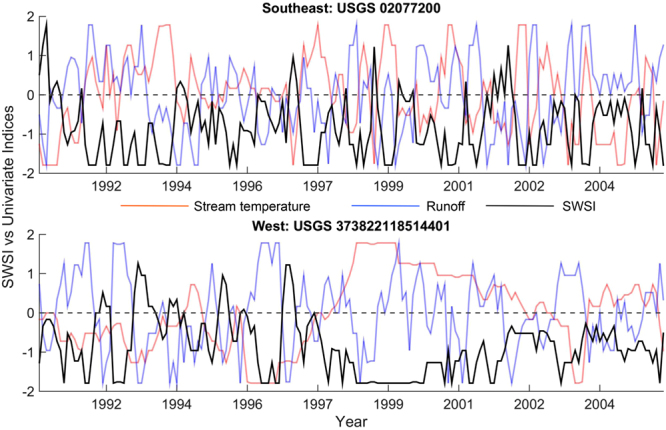
Figure 4.

Time series comparison of SWSI relative to univariate water stress indices. Sample time series of 3-month SWSI is compared with standardized low surface runoff flow and high stream temperature indices at 3-month time scale. The top and bottom panel shows selected USGS gauge locations over Southeast (North Carolina, USGS Station ID 02077200, latitude 36.39° and longitude 79.20°) and West (California, USGS Station ID 373822118514401, latitude 37.64° and longitude 118.86°). Figures are generated using MATLAB 2015a (Version 8.5, http://www.mathworks.com) [Software].
